
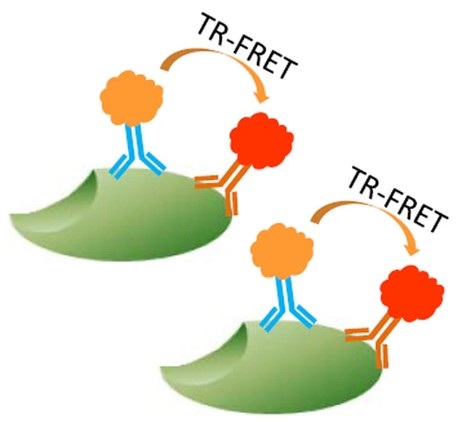
Time-resolved fluorescence resonance energy transfer (TR-FRET), also described as time-resolved Förster resonance energy transfer, combines proximity-dependent energy transfer with delayed fluorescence detection. The method can be adapted to biochemical or cell-based assays for molecular binding, protein-protein interactions, receptor-ligand recognition, enzyme activity, nucleic acid interactions, target quantification, signaling studies, and compound screening.
As a specialized capability within our Fluorescence Resonance Energy Transfer (FRET) Services, Profacgen provides custom TR-FRET assay feasibility assessment, reagent and format selection, assay development, optimization, fit-for-purpose qualification, screening, and data analysis. Each project is configured according to the biological question, molecular system, reagent availability, expected signal range, sample matrix, throughput, and intended use of the results.
FRET is a nonradiative transfer of excitation energy from a donor fluorophore to a compatible acceptor. Transfer efficiency depends strongly on donor-acceptor distance, spectral overlap, fluorophore orientation, and the local environment. Because useful energy transfer usually occurs over nanometer-scale distances, FRET can report whether labeled molecules or labeled regions of a molecule are brought into proximity.
Conventional intensity-based FRET can be affected by scattered excitation light, direct acceptor excitation, donor bleed-through, sample autofluorescence, and differences in fluorophore concentration. TR-FRET reduces some of these sources of prompt background by using a donor with a comparatively long emission lifetime, commonly a lanthanide complex, and measuring emission after a defined delay. Short-lived autofluorescence and scattered light decay before the measurement window, while donor-associated and sensitized acceptor emission remain detectable.
The resulting signal is frequently expressed as an acceptor-to-donor ratio. Ratiometric normalization can reduce variation caused by well volume, excitation intensity, or reagent dispensing, but it does not remove every source of interference. Reliable interpretation still requires suitable controls, a defined quantitative range, and confirmation that a change in signal reflects the molecular event addressed by the assay.
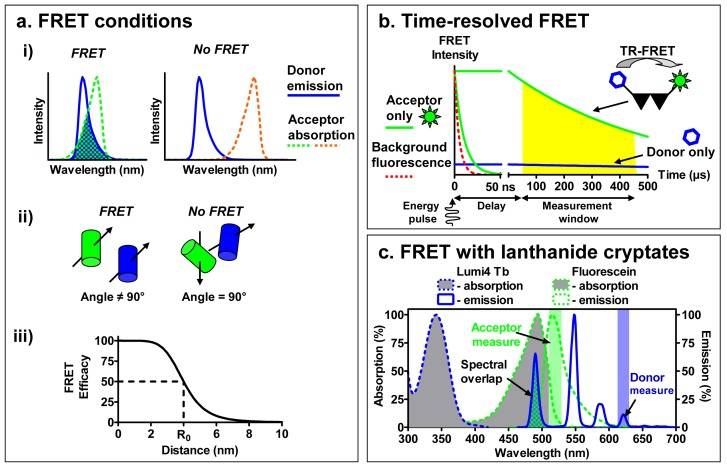 Figure 1. Principles of FRET and TR-FRET. (Cottet et al., 2011)
| Feature | Conventional FRET | TR-FRET |
|---|---|---|
| Detection timing | Emission is generally measured during or shortly after excitation. | Emission is measured after a defined delay and may be integrated over a time window. |
| Typical donor | Organic fluorophore or fluorescent protein | Long-lifetime donor, commonly a lanthanide complex |
| Prompt background | Autofluorescence and scattered light may contribute substantially. | Delayed detection reduces many short-lived background signals. |
| Assay implementation | Often used in imaging, biosensors, and solution-based interaction studies | Frequently configured for microplate-based biochemical, immunoassay, cell-based, or screening workflows |
| Important limitation | Requires correction for spectral cross-talk and expression or labeling differences. | Still depends on labeling geometry, reagent behavior, matrix compatibility, and reader settings. |
Molecular Binding and Competition Assays
TR-FRET formats designed to measure association, displacement, inhibition, or competition under defined equilibrium conditions.
Protein-Protein Interaction Assays
Proximity assays for the formation, disruption, or modulation of defined protein complexes.
Enzyme Activity and Substrate Assays
Activity-dependent formats in which enzymatic turnover changes donor-acceptor proximity or reagent recognition.
Target Quantification Immunoassays
Homogeneous sandwich or tag-assisted assays for relative or calibrated target measurement.
Cell Signaling and Pathway Assays
Cell-based or lysate-based measurement of selected signaling events after receptor stimulation or compound treatment.
Screening, Miniaturization, and Transfer
Optimization of reproducible microplate workflows for candidate comparison or compound screening.
The optimal configuration is determined by what must be brought into proximity, which components can be labeled or recognized, and how the biological event changes the signal.
| Configuration | Signal Principle | Suitable Questions | Key Limitation |
|---|---|---|---|
| Direct binding | Donor- and acceptor-associated binding partners generate signal after complex formation. | Defined receptor-ligand, protein-protein, or protein-nucleic acid interactions | Label placement and reagent valency can alter apparent binding behavior. |
| Competitive displacement | A test compound reduces signal by displacing a labeled or indirectly detected binding partner. | Inhibition, blocking, ligand ranking, and selected affinity studies | IC50 depends on assay concentrations and is not automatically equal to Kd or Ki. |
| Sandwich immunoassay | Two affinity reagents bind distinct epitopes on the same analyte. | Target abundance, modification state, cleavage, or complex-associated analytes | Requires two compatible reagents and may show a hook effect at high analyte concentration. |
| Enzymatic conversion | Substrate processing creates or disrupts proximity or changes recognition by a detection reagent. | Kinase, phosphatase, protease, and other enzyme activity | Readout may reflect multiple coupled steps and requires suitable enzyme and substrate controls. |
| Cell-based proximity | Cell stimulation or compound treatment changes proximity between labeled or detected components. | Receptor signaling, adaptor recruitment, pathway activation, or intracellular target engagement | Cell permeability, expression, trafficking, cytotoxicity, and lysis efficiency can influence signal. |
| Tagged target assay | Tag-selective reagents and target-selective reagents report abundance or interaction. | Early feasibility, construct comparison, or targets lacking suitable endogenous reagent pairs | Tag position and expression level may change molecular behavior. |
TR-FRET performance depends on the photophysical compatibility and physical arrangement of the donor and acceptor. Long-lifetime donors are commonly based on europium or terbium complexes, while compatible acceptors are selected according to spectral overlap, reader capability, assay matrix, and desired emission channel. Reagents may be labeled directly or detected indirectly through tags, anti-species antibodies, streptavidin-biotin interactions, or other affinity pairs.
Labeling chemistry must preserve the activity and specificity of the reagent. Random amine labeling may generate a distribution of labeling sites and degrees of labeling, while site-selective strategies can provide more consistent orientation when the necessary construct or functional group is available. Labeling density, reagent valency, linker length, and tag placement should be assessed because they can change binding, steric accessibility, or nonspecific background.
Donor and acceptor distance alone does not determine assay success. Productive geometry, rotational freedom, spectral cross-talk, direct acceptor excitation, and the proportion of correctly labeled complexes also influence the observed ratio. Empirical testing of labeling orientation and reagent concentration is therefore a central part of TR-FRET assay development.
| Development Factor | Why It Matters | Typical Evaluation |
|---|---|---|
| Reagent affinity and specificity | Weak or nonspecific recognition limits assay window and biological interpretation. | Reagent titration, negative targets, competition controls, and orthogonal binding evidence |
| Labeling orientation | Donor and acceptor must approach in a productive geometry without disrupting function. | Reciprocal labeling, tag-position comparison, and donor-acceptor matrix testing |
| Component concentrations | Assay concentrations affect equilibrium, signal, ligand depletion, and observed potency. | Cross-titration around biologically and analytically relevant concentration ranges |
| Matrix and buffer | Detergents, salts, reducing agents, proteins, nucleic acids, and colored materials can alter signal or binding. | Buffer screening, dilution studies, spike recovery, and interference testing |
| Detection timing | Incubation, delay, and integration settings influence equilibrium and signal separation. | Time-course testing and reader-setting optimization |
| Compound interference | Fluorescent, quenching, aggregating, colored, or redox-active compounds can distort results. | Donor-only, acceptor-only, no-target, and orthogonal counterscreens |
| Assay quality | Screening requires stable separation between controls across a plate and across runs. | Signal-to-background, coefficient of variation, edge-effect review, and Z′ assessment |

| Output | What It Represents | Interpretive Qualification |
|---|---|---|
| TR-FRET ratio | Acceptor-associated emission normalized to donor-associated emission according to the reader configuration. | Reduces some technical variation but does not eliminate matrix, labeling, or compound interference. |
| EC50 or IC50 | Concentration producing half of the modeled activation or inhibition response under the tested conditions. | Assay-dependent and not automatically equivalent to intrinsic affinity or cellular potency. |
| Apparent Kd | Equilibrium binding parameter estimated from a suitable direct or competition design. | Requires an appropriate model, concentration coverage, equilibrium, and control of ligand depletion and reagent valency. |
| Relative interaction or abundance | Normalized signal compared with a vehicle, reference, wild-type, or other defined control. | Valid only within the established response range and for the molecular species recognized by the assay. |
| Enzyme activity response | Substrate conversion or modification inferred from a change in TR-FRET signal. | May require reaction-rate analysis and controls for coupled detection steps. |
| Assay performance metrics | Signal-to-background, coefficient of variation, Z′, plate uniformity, and control stability. | Acceptance criteria should be matched to assay purpose and screening stage. |
Conventional endpoint TR-FRET does not directly measure association and dissociation rate constants such as kon and koff. Those kinetic parameters generally require time-resolved binding methods designed to follow association and dissociation, such as surface plasmon resonance or bio-layer interferometry, when suitable for the molecular system.
TR-FRET can support targeted protein degradation without defining the broader technology. A sandwich immunoassay may quantify endogenous target abundance in cell lysates after compound treatment, while tag-assisted formats may support early feasibility or construct-based studies. Separately designed proximity assays can examine ternary-complex formation, target ubiquitination, or other defined pathway steps.
These readouts should not be treated as interchangeable. Target abundance, molecular proximity, and ubiquitination answer different questions, and proximity alone does not demonstrate productive degradation. For degrader-specific assay strategy, concentration-response profiling, and orthogonal confirmation, visit our Protein Degradation Assays page. For continuous live-cell target-abundance monitoring, explore Real-Time Protein Degradation Kinetics Measurement.
Project Need:
A discovery team required a microplate assay to compare compounds that might disrupt a defined protein complex.
Study Approach:
Donor and acceptor labeling orientations were compared, followed by cross-titration of both partners and evaluation of incubation time, buffer, nonspecific background, and unlabeled competitor controls. Compounds were tested with donor-only, acceptor-only, and aggregation or fluorescence-interference counterscreens.
Outcome:
The optimized assay supported concentration-response ranking and identified which apparent hits required orthogonal confirmation. This scenario illustrates a possible workflow; actual performance depends on the molecular system, reagents, and compounds.
Project Need:
A research program needed to compare pathway activation across ligand concentrations and treatment times without relying on a multistep wash-based assay.
Study Approach:
Total-target and modification-selective antibodies were screened as a proximity pair. Cell number, lysis conditions, stimulation time, reagent concentrations, and matrix tolerance were optimized. Pathway inhibitor and cell-health controls were included to support interpretation.
Outcome:
The assay enabled relative measurement of the selected phosphorylation state in matched lysates and supported ligand-response comparisons. The result was interpreted as an epitope-defined signaling readout rather than a complete measure of pathway activity.
References:
Fill out this form and one of our experts will respond to you within one business day.