We use cookies to understand how you use our site and to improve the overall user experience. This includes personalizing content and advertising. Read our
Privacy Policy
At Profacgen, our protein-fluorophore conjugation service provides precise, high-efficiency attachment of fluorescent dyes to proteins, antibodies, peptides, and other biomolecules, enabling visualization, quantification, and functional analysis across the full spectrum of biological and diagnostic applications. Fluorescence-based detection of single biomolecules under physiological conditions has fundamentally transformed how researchers study protein localization, dynamics, interactions, and expression, making fluorophore bioconjugation an indispensable tool in modern life sciences.
Profacgen offers a comprehensive fluorophore labeling platform that spans traditional amine-based and thiol-based chemistries through to cutting-edge site-specific approaches including tyrosine-directed bioconjugation, click chemistry for pre-labeled proteins, and custom labeling strategies tailored to demanding applications such as single-molecule imaging, FRET-based biosensing, and super-resolution microscopy. With years of experience in protein chemistry, our team ensures that each conjugation is optimized for brightness, stability, and retention of biological activity.
Background: Fluorophore Photophysics and Labeling Strategies
Choosing the right fluorophore and conjugation chemistry requires understanding key photophysical properties: excitation/emission maxima (matched to instrument optics), extinction coefficient (absorption efficiency), quantum yield (emission efficiency), photostability (resistance to bleaching), and Stokes shift (affects signal-to-background ratio).
Common organic fluorophore classes include:
Cyanines (Cy3, Cy5, Cy7): high extinction coefficients, tunable visible-to-NIR emission.
Fluorescein/rhodamine derivatives: high quantum yields, laser-compatible.
Sulfonated fluorescent dyes: sulfonated for improved solubility, reduced self-quenching, and enhanced photostability.
NIR dyes: deep tissue imaging with low autofluorescence.
Reaction conditions: pH 6.5–7.5, RT, 15–30 min; stable thioether bond
DOL: 1–3 fluorophores per protein (depends on free cysteine content)
Best for: FRET pair construction, single-molecule imaging, site-specific labeling
Tyrosine-Directed Fluorophore Bioconjugation
Orthogonal labeling chemistry targeting phenolic hydroxyl groups of tyrosine residues, providing an alternative when amine and thiol labeling compromise activity.
Chemistry: Diazonium coupling; electrophilic aromatic substitution with activated fluorophore derivatives
Reaction: Mild conditions near neutral pH; short reaction times (10–20 min)
Orthogonal to amine and thiol chemistries; can be performed sequentially
Best for: proteins where amine/thiol modification disrupts function; dual-labeling strategies
Click Chemistry Fluorophore Conjugation
Bioorthogonal, site-specific fluorophore installation on proteins pre-functionalized with azide, alkyne, or tetrazine handles, enabling precise control over labeling position and stoichiometry.
Photostable dyes with high quantum yield (Atto 647N, Sulfonated fluorescent dye 647, Cy5 with oxygen scavengers)
Analytical Characterization
Every fluorophore conjugation includes comprehensive quality control:
Analysis
Details
Degree of labeling (DOL)
Calculated from Amax/A280 ratio using the dye's extinction coefficient and correction factor
Intact mass spectrometry
Confirms expected mass shift corresponding to fluorophore attachment
Free dye removal
SEC, dialysis, or spin-column purification to <1% residual free dye
Functional validation
Antigen-binding (SPR/BLI), enzymatic activity, or cell-binding assays as appropriate
Photophysical characterization
Excitation/emission spectra, quantum yield determination, photobleaching half-time under standardized excitation
Applications
Immunofluorescence microscopy: Direct and indirect staining of cellular targets with bright, photostable fluorophore conjugates
Flow cytometry: Multi-parameter cell analysis using fluorophore-labeled antibodies against cell surface and intracellular markers
FRET-based biosensors: Quantitative detection of protein-protein interactions, conformational changes, and enzymatic activity through distance-dependent fluorescence energy transfer
Single-molecule imaging: Tracking individual protein dynamics in living cells with photostable organic dyes
Super-resolution microscopy: Photoswitchable fluorophores for dSTORM, PALM, and STED imaging beyond the diffraction limit
In vivo imaging and image-guided surgery: Near-infrared fluorophore conjugates for deep tissue visualization and intraoperative margin delineation
Fluorescence polarization assays: Homogeneous, mix-and-read binding assays for high-throughput screening
Representative Case Studies
Case Study 1: Seven-Color Flow Cytometry Panel Using Spectrally Distinct Fluorophore-Antibody Conjugates
Background:
An immunology core facility needed to develop a seven-color flow cytometry panel for immune profiling of tumor-infiltrating lymphocytes (TILs), requiring fluorophore-antibody conjugates with minimal spectral overlap and consistent staining intensity across all markers.
Approach:
Profacgen conjugated seven antibodies (anti-CD3, CD4, CD8, CD45RA, CD62L, PD-1, FoxP3) with a spectrally optimized fluorophore set: Sulfonated fluorescent dye 488, PE, PerCP-Cy5.5, PE-Cy7, APC, APC-Sulfonated dye 750, and Pacific Blue. Each conjugation was optimized individually to achieve DOL 3–5 for IgG-format antibodies. Single-stained compensation controls and fluorescence-minus-one (FMO) controls were prepared.
Outcome:
All seven conjugates showed <0.5% spillover into non-primary detectors after compensation. Staining indices (signal-to-background ratio) ranged from 50 to 200, exceeding the facility's minimum threshold of 30 for all markers. The seven-color panel successfully resolved 12 distinct T cell subpopulations from fresh tumor digests, including rare Tregs (CD4+FoxP3+, 2.3% of CD45+ cells) and exhausted CD8+ T cells (CD8+PD-1+, 18.7%). The panel has been adopted as the standard TIL profiling assay and is run weekly for 50+ clinical trial samples.
Case Study 2: dSTORM Super-Resolution Imaging with Photoswitchable Fluorophore-Antibody Conjugates
Background:
A cell biology laboratory needed to visualize the nanoscale organization of a adhesion protein at focal adhesions with <20 nm resolution, beyond the diffraction limit of conventional confocal microscopy.
Approach:
Profacgen conjugated a monoclonal anti-adhesion protein antibody with Sulfonated fluorescent dye 647 using NHS ester chemistry at DOL = 2.5. The conjugate was purified by SEC to remove free dye, and the photoswitching behavior was characterized in dSTORM imaging buffer containing a thiol (MEA) and an oxygen scavenger system. U2OS cells were fixed, permeabilized, stained, and imaged on a custom-built dSTORM system.
Outcome:
The Sulfonated fluorescent dye 647 conjugate exhibited robust photoswitching with a blinking frequency of ~2 events/second per fluorophore under 642 nm excitation at 5 kW/cm2. Single-molecule localization precision was 12 nm (1D, 1 standard deviation). The reconstructed dSTORM image revealed that the adhesion protein organized into elongated clusters (average length 180 nm, width 45 nm) at focal adhesions, a substructure not resolvable by confocal imaging. Quantitative cluster analysis showed that the cluster aspect ratio correlated with cell spreading area (R2 = 0.74), providing new mechanistic insights into adhesion maturation.
A: The optimal fluorophore depends on your detection system and application. For confocal microscopy: match to your laser lines (488 nm: Sulfonated fluorescent dye 488; 561 nm: Sulfonated dye 568; 633/635 nm: Sulfonated dye 647). For flow cytometry: consider brightness and spillover (Sulfonated fluorescent dye 647 is brighter and more photostable than APC). For in vivo imaging: choose NIR dyes (Sulfonated dye 750, IRDye 800CW) for deep tissue penetration. For single-molecule studies: select photostable dyes (Atto 647N, Sulfonated dye 647 with oxygen scavengers). For super-resolution: use photoswitchable dyes (Sulfonated dye 647 for dSTORM). We provide fluorophore selection guidance based on your instrument configuration and experimental requirements.
Q: What is the optimal degree of labeling (DOL) for my antibody?
A: The optimal DOL depends on the application. For flow cytometry: DOL 3–6 provides the brightest staining with acceptable self-quenching. For immunofluorescence: DOL 2–4 balances brightness and penetration. For FRET: DOL 1–2 for the donor, DOL 1 for the acceptor to avoid acceptor self-quenching. For single-molecule imaging: DOL 0.5–1 (partial labeling) to ensure single fluorophore per protein. Higher DOL increases brightness but can cause self-quenching (reduced quantum yield), increased non-specific binding, and activity loss. We optimize DOL for each project through small-scale titration experiments.
Q: Does fluorophore labeling affect antibody binding affinity?
A: At optimal DOL (typically 3–5 for amine labeling), most antibodies retain >85% of their binding affinity. Higher DOL (>8) can cause significant affinity loss due to modification of surface residues near the complementarity-determining regions (CDRs). We mitigate this by: (1) using Fab-specific labeling kits when the Fc region can be targeted; (2) performing thiol-directed labeling at the hinge region for site-specific attachment; (3) titrating reagent-to-antibody ratios to achieve the desired DOL without over-labeling; and (4) confirming antigen-binding affinity by SPR or ELISA as part of standard quality control. If an antibody is particularly sensitive, we can explore tyrosine-directed or click chemistry approaches.
Q: How do you remove free (unconjugated) fluorophore?
A: We employ multiple purification strategies to ensure <1% residual free dye: size-exclusion chromatography (SEC) separates the larger protein-fluorophore conjugate from small-molecule free dye based on size; dialysis using 10–20 kDa molecular weight cutoff membranes removes free dye through diffusion; spin desalting columns provide rapid buffer exchange for small volumes; and for challenging cases, anion-exchange chromatography exploits the increased negative charge of many sulfonated fluorophores to separate labeled from unlabeled protein. The final product is verified by analytical SEC or thin-layer chromatography to confirm free dye removal.
Q: What are typical timelines and costs?
A: A standard fluorophore conjugation project proceeds as follows: project consultation and fluorophore selection (1–2 days), conjugation reaction and purification (2–3 days), analytical characterization including DOL determination and free dye removal verification (2–3 days)—total 5–8 business days from receipt of protein or antibody. Costs depend on the fluorophore (proprietary Sulfonated fluorescent dyes are priced higher than standard FITC/Cy dyes), the scale (microgram to milligram), and the complexity of purification. We provide detailed quotations during the consultation phase. Rush service (3-day turnaround) is available for qualified projects.
References:
Fili N, Toseland CP. Fluorescence and labelling: how to choose and what to do. In: Toseland CP, Fili N, eds. Fluorescent Methods for Molecular Motors. Vol 105. Springer Basel; 2014:1-24. doi:10.1007/978-3-0348-0856-9_1
Online Inquiry
Fill out this form and one of our experts will respond to you within one business day.

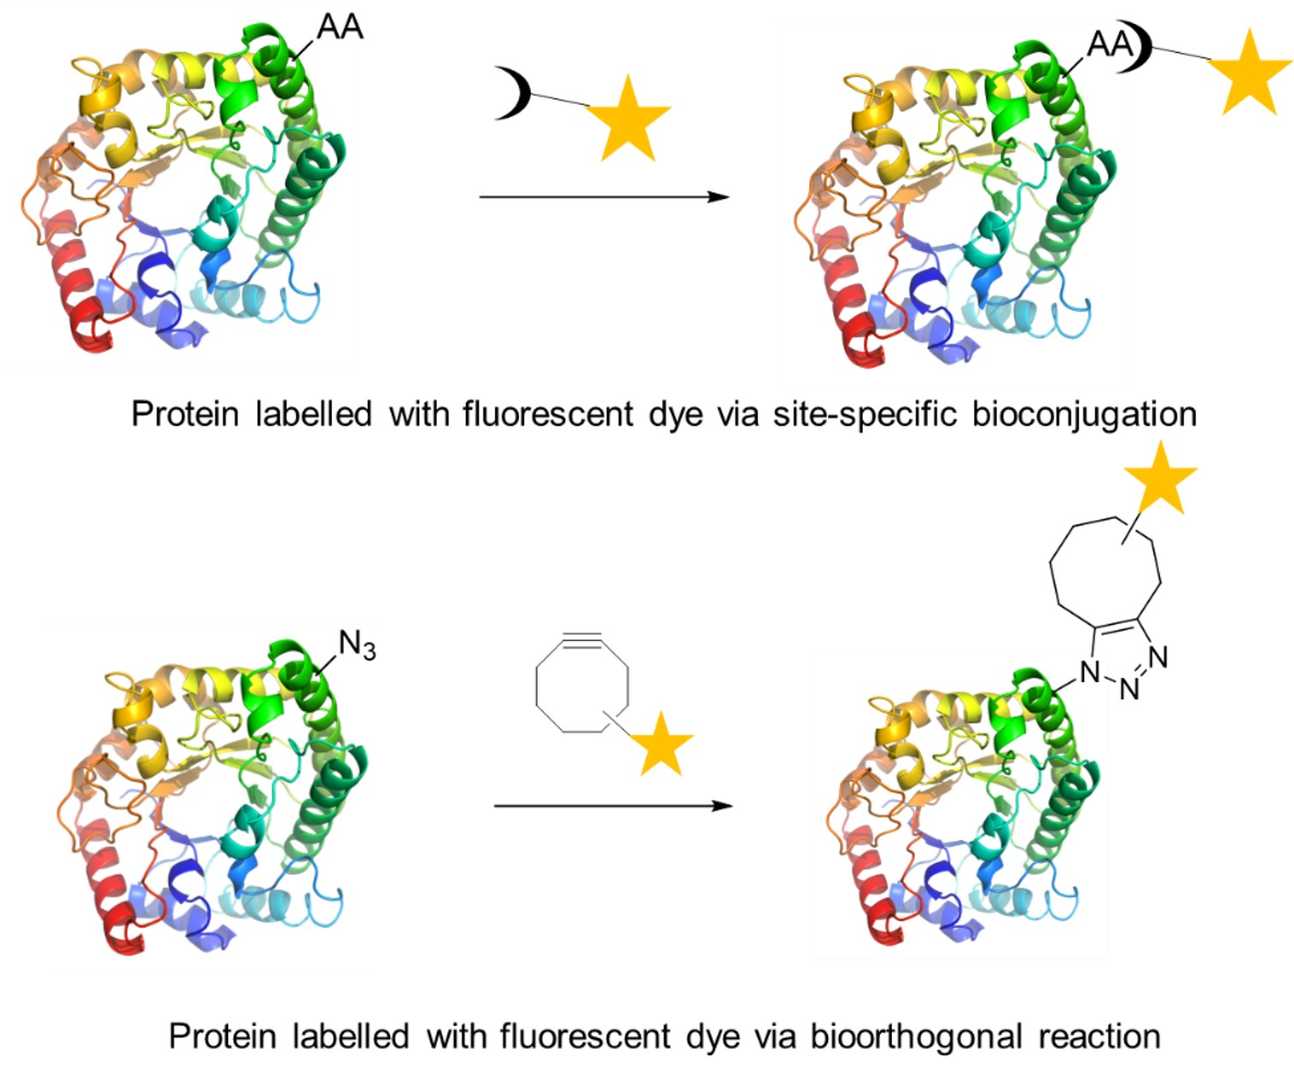 Figure 1. Fluorescent labelling of proteins. (Adapted from Fili and Toseland, 2014)