We use cookies to understand how you use our site and to improve the overall user experience. This includes personalizing content and advertising. Read our
Privacy Policy
Fluorescence resonance energy transfer (FRET) is a foundational biophysical technique that enables quantitative detection of molecular proximity and conformational dynamics at the nanometer scale. Based on non-radiative dipole-dipole energy transfer between a donor fluorophore and an acceptor chromophore, FRET produces a distance-dependent ratiometric signal that reports on intermolecular associations, intramolecular rearrangements, and spatial organization within complex biological assemblies. The development of genetically encoded fluorescent proteins—particularly the green fluorescent protein (GFP) family and its spectral variants—has transformed FRET from a specialized spectroscopic method into a versatile, genetically programmable tool for live-cell molecular imaging. Profacgen provides comprehensive FRET assay services leveraging advanced fluorescent protein pairs, synthetic dye conjugates, and state-of-the-art detection platforms to support protein-protein interaction mapping, receptor conformational analysis, and high-throughput screening in physiologically relevant cellular contexts.
Principle and Instrumentation
FRET occurs when two fluorophores are positioned within the Förster radius (typically 1–10 nm) and satisfy the requisite spectral and orientational conditions for resonance energy transfer. The efficiency of transfer is exquisitely sensitive to intermolecular distance, decaying with the sixth power of separation, making FRET an ideal molecular ruler for biological proximity detection.
Figure 1. Principle of frustrated FRET. (a) When only the donor is excited, the fluorescence resonance energy is transferred from the donor to the acceptor, quenching the donor fluorescence. (b) When the donor and the acceptor are excited at the same time, FRET is inhibited, recovering the donor fluorescence. (Xu et al., 2013)
Mechanistic Basis
The FRET phenomenon is governed by three fundamental requirements:
Spectral Overlap: The emission spectrum of the donor fluorophore must overlap with the excitation/absorption spectrum of the acceptor molecule. The integral of this overlap, combined with the donor quantum yield and the refractive index of the medium, determines the Förster distance (R0)—the interprobe separation at which 50% energy transfer efficiency is achieved
Proximity Constraint: The intermolecular distance between donor and acceptor dipoles must be within approximately 10 nm. At distances below 1 nm, ground-state complex formation and photophysical artifacts dominate; beyond 20 nm, energy transfer becomes negligible
Dipole Orientation: The relative orientation of donor emission and acceptor absorption dipoles, described by the orientation factor κ², modulates transfer efficiency. For freely rotating fluorophores in solution, κ² averages to 2/3; rigidly tethered probes require explicit orientation correction
Hybrid Systems: SNAP-tag/CLIP-tag labeling with cell-permeable fluorophores (TMR, BG-547) for endogenous protein tagging with synthetic dye brightness
Applications
FRET technology spans fundamental cell biology, drug discovery, and clinical diagnostics, providing unique capabilities for proximity detection and conformational readout in living systems.
Intercellular Interaction and Membrane Protein Proximity Mapping
Real-time visualization of receptor clustering, lipid raft organization, and immune synapse formation at the cell-cell interface. FRET between membrane-anchored fluorescent proteins reports on nanoscale receptor co-localization beyond the diffraction limit of conventional microscopy, enabling mapping of signaling microdomains and adhesion complex assembly.
Cell Membrane Receptor Protein Interaction Analysis
Quantitative assessment of GPCR oligomerization, growth factor receptor dimerization, and ion channel subunit assembly. FRET biosensors discriminate between monomeric, dimeric, and higher-order oligomeric states, providing mechanistic insights into receptor activation and allosteric modulation relevant to therapeutic targeting.
Intracellular Conformational Change Monitoring
Intramolecular FRET biosensors (cameras) engineered with donor and acceptor flanking conformationally responsive domains report on kinase activation, GTPase switching, calcium flux, and protease cleavage through distance or orientation changes. These genetically encoded reporters enable single-cell kinetic analysis of signaling dynamics with sub-second temporal resolution.
Apoptosis and Cell Death Pathway Analysis
FRET-based caspase substrates and mitochondrial membrane potential reporters quantify the progression of intrinsic and extrinsic apoptosis pathways. Loss of FRET upon caspase-3/7 cleavage of a DEVD linker provides a direct, ratiometric indicator of apoptotic commitment, supporting cytotoxicity profiling and mechanism-of-action studies for oncology drug candidates.
Nucleic Acid Hybridization and Molecular Diagnostics
FRET between fluorophore-labeled oligonucleotide probes enables homogeneous detection of DNA/RNA targets, SNP discrimination, and real-time PCR quantification (molecular beacons, dual-labeled hydrolysis probes). These formats eliminate separation steps and support point-of-care diagnostic development with high specificity and single-molecule sensitivity.
High-Throughput Drug Screening and Biosensor Development
Plate-based FRET assays for GPCR ligand binding, kinase inhibitor profiling, and protein-protein interaction disruption. Ratiometric readout corrects for well-to-well variations in cell number and expression level, enabling robust Z'-factor performance in automated screening campaigns.
Technical Advantages
Live-Cell Physiological Compatibility: Measurements performed under normal cell culture conditions preserve post-translational modifications, native protein folding, and correct subcellular trafficking unavailable in lysate-based or fixed-cell methods
Nanometer-Scale Distance Sensitivity: Förster distance-dependent signal provides molecular ruler capability for 1–10 nm proximity detection, resolving interactions beyond the ~200 nm diffraction limit of light microscopy
Single-Molecule and Single-Cell Resolution: Confocal and TIRF-based FRET detection enables analysis of individual receptor molecules and subcellular compartments, revealing population heterogeneity invisible to bulk assays
Ratiometric Quantification: Acceptor/donor emission ratio corrects for expression level variation, photobleaching, and instrument fluctuations, providing internally normalized, reproducible interaction metrics
Conformational Dynamics Readout: Intramolecular FRET biosensors report on protein shape changes, domain rearrangements, and allosteric transitions with high temporal fidelity, linking structure to function in real time
Multimodal Integration: Compatible with fluorescence microscopy, flow cytometry, high-content imaging, electrophoresis, and chromatography platforms for versatile experimental design
Service Procedure
Profacgen delivers comprehensive FRET services from molecular construct design through quantitative data analysis, ensuring robust proximity measurements and mechanistic interpretation.
Construct Design and Molecular Engineering: Selection of optimal donor-acceptor pairs based on spectral separation, brightness, photostability, and target protein topology; linker length and composition optimization to maximize dynamic range while preserving biological function; subcellular targeting sequence incorporation for organelle-specific interaction mapping
Cell Line Generation and Expression Validation: Transient or stable transfection into physiologically relevant backgrounds; fluorescence-activated cell sorting for uniform expression populations; Western blot and confocal imaging confirmation of correct fusion protein size, localization, and expression level
Spectral Calibration and Crosstalk Correction: Determination of donor bleed-through into acceptor channel, direct acceptor excitation by donor wavelength, and spectral unmixing coefficients; establishment of instrument-specific calibration constants for quantitative FRET efficiency calculation
Live-Cell Imaging and Kinetic Acquisition: Time-lapse confocal or widefield microscopy with environmental control (37°C, 5% CO2, humidity) for long-duration interaction tracking; high-throughput microplate reader assays for population-level screening; FLIM acquisition for quantitative lifetime-based FRET efficiency mapping
Data Processing and Quantitative Analysis: Background subtraction, spectral unmixing, FRET efficiency calculation (E = 1 – τDA/τD for FLIM; E = (IA – crosstalk)/(ID + IA) for sensitized emission); distance histogram generation and statistical comparison across experimental conditions
Pharmacological and Mechanistic Interpretation: Dose-response analysis of ligand-induced interaction changes, kinetic modeling of association/dissociation dynamics, and correlation with orthogonal biochemical and structural data
Case 1: Intramolecular FRET Biosensor for Real-Time GPCR Conformational Dynamics
Background:
A drug discovery program targeting a class B GPCR required mechanistic understanding of how allosteric modulators altered receptor conformation to bias signaling toward G protein versus β-arrestin pathways. Crystal structures captured only inactive-state conformations, and biochemical assays provided endpoint readouts insufficient to resolve the kinetic sequence of activation.
Our Solution:
Profacgen engineered an intramolecular FRET biosensor by inserting Cerulean (donor) at the receptor N-terminus and inserting Venus (acceptor) within the third intracellular loop—a region known to undergo rearrangement upon activation. The construct was stably expressed in HEK293 cells and validated for ligand binding affinity and signaling fidelity comparable to wild-type receptor. Using TIRF microscopy with 100 ms frame acquisition, we captured FRET ratio changes upon rapid ligand perfusion, resolving the temporal sequence of conformational transitions.
Final Results:
The FRET biosensor revealed that G protein-biased allosteric modulators induced a rapid, transient conformational state (FRET efficiency decrease within 200 ms) distinct from the sustained conformation adopted by balanced agonists. β-arrestin-biased ligands produced an intermediate FRET signature. These conformational fingerprints enabled classification of compound libraries by mechanism and guided structure-based design of next-generation biased agonists with improved therapeutic indices.
Case 2: Hetero-FRET Mapping of EGFR-HER2 Heterodimerization in Cancer Cell Lines
Background:
An oncology research group investigating resistance mechanisms to EGFR inhibitors needed to quantify EGFR-HER2 heterodimer formation across a panel of non-small cell lung cancer (NSCLC) cell lines with varying HER2 expression levels. Co-immunoprecipitation provided binary presence/absence data but no information on dimerization stoichiometry or subcellular localization, while proximity ligation assays lacked live-cell temporal resolution.
Our Solution:
Profacgen established a hetero-FRET system with EGFR-EGFP (donor) and HER2-mCherry (acceptor) fusions, introduced by lentiviral transduction into six NSCLC lines. Spectral crosstalk was rigorously quantified using single-transfection controls, and acceptor photobleaching FRET was employed as an independent validation of sensitized emission results. FLIM-FRET provided quantitative distance distributions independent of expression level variation.
Final Results:
FRET efficiency correlated positively with HER2 expression level but revealed substantial cell-to-cell heterogeneity within each line, with a subpopulation showing near-maximal FRET indicative of high-order oligomerization. EGF stimulation increased FRET efficiency by 40% in HER2-high cells but not in HER2-low cells, identifying a HER2 expression threshold for ligand-induced heterodimerization. These findings explained differential sensitivity to pan-HER inhibitors and supported patient stratification biomarker development for clinical trial enrollment.
Q: What is the optimal distance range for FRET detection, and how does it compare to BRET?
A: FRET is most sensitive in the 1–10 nm distance range, with maximal dynamic range around the Förster distance R0 (typically 4–6 nm for common fluorophore pairs). Below 1 nm, ground-state complex formation and photophysical quenching artifacts dominate; beyond 10 nm, energy transfer becomes negligible. BRET operates over a similar distance range but uses bioluminescent donors, eliminating phototoxicity and autofluorescence at the cost of reduced spectral flexibility. FRET offers greater donor-acceptor pairing options and is more readily combined with advanced microscopy modalities, while BRET provides superior signal-to-noise in long-duration live-cell experiments.
Q: How is spectral crosstalk corrected in sensitized emission FRET?
A: Spectral crosstalk correction requires three calibration measurements: (1) donor-only samples to quantify donor bleed-through into the acceptor emission channel; (2) acceptor-only samples to quantify direct excitation of acceptor by the donor excitation wavelength; and (3) double-negative samples for background subtraction. The corrected FRET signal is calculated as: IFRET = Iraw – (donor bleed-through coefficient × Idonor) – (acceptor excitation coefficient × Iacceptor). Profacgen implements pixel-by-pixel correction algorithms and validates results using acceptor photobleaching and FLIM as independent confirmation methods.
Q: Can FRET detect conformational changes within a single protein?
A: Yes, through intramolecular FRET biosensors. By genetically fusing donor and acceptor fluorophores to different domains of the same protein, distance or orientation changes upon ligand binding, phosphorylation, or allosteric activation alter FRET efficiency. These "FRET cameras" have been engineered for kinases, GTPases, proteases, ion channels, and receptors. The dynamic range depends on the amplitude of conformational change relative to R0; maximal sensitivity is achieved when the resting and active states straddle the Förster distance. Profacgen optimizes linker length and fluorophore insertion sites to maximize biosensor response amplitude.
Q: What are the limitations of GFP-based FRET pairs, and what alternatives exist?
A: Conventional GFP variants (CFP, YFP, GFP) suffer from moderate brightness, pH sensitivity, and tendency to dimerize at high concentrations, which can introduce artifacts in FRET quantification. Modern alternatives include: (1) monomeric Aequorea variants (mTurquoise2, mVenus, mClover3) with improved photostability and reduced dimerization; (2) red-shifted coral-derived proteins (mRuby2, mKate2) for reduced cellular autofluorescence background; (3) hybrid systems combining SNAP-tag/CLIP-tag labeling with synthetic dyes for superior brightness and photostability; and (4) near-infrared FRET pairs for deep-tissue imaging applications. Profacgen selects optimal pairs based on target properties and experimental requirements.
Q: How does FLIM-FRET differ from intensity-based FRET, and when should it be used?
A: FLIM-FRET measures the reduction in donor fluorescence lifetime caused by energy transfer to the acceptor, rather than monitoring acceptor emission intensity. This approach is independent of fluorophore concentration, excitation intensity, and partial acceptor photobleaching—major confounding factors in intensity-based measurements. FLIM-FRET provides absolute FRET efficiency values (E = 1 – τDA/τD) and enables quantitative distance mapping. It is the method of choice when accurate efficiency quantification is required, when expression levels vary across samples, or when quantitative comparison across multiple experiments and laboratories is essential. The trade-off is increased instrumentation complexity and longer acquisition times compared to intensity-based methods.
Q: What is the typical project timeline for FRET assay development?
A: Standard FRET biosensor development from construct design to validated live-cell imaging typically requires 8–10 weeks: 2–3 weeks for construct generation and sequence verification, 2 weeks for stable cell line establishment and expression validation, 2 weeks for spectral calibration and imaging protocol optimization, and 2–3 weeks for pilot experiments and quantitative analysis pipeline development. High-throughput microplate-based FRET screening assays can be developed in 4–6 weeks using transient transfection formats. Complex multi-parameter FLIM-FRET projects with custom image analysis algorithms may extend to 12–14 weeks. Expedited timelines are available for time-critical drug discovery campaigns.
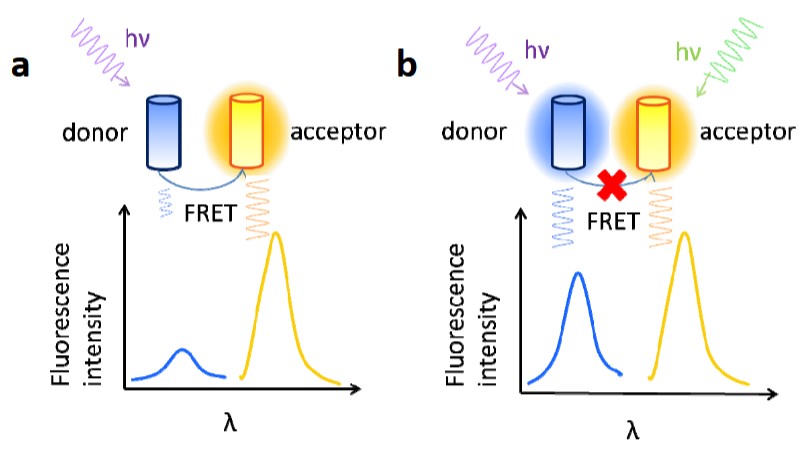 Figure 1. Principle of frustrated FRET. (a) When only the donor is excited, the fluorescence resonance energy is transferred from the donor to the acceptor, quenching the donor fluorescence. (b) When the donor and the acceptor are excited at the same time, FRET is inhibited, recovering the donor fluorescence. (Xu et al., 2013)