
Affinity Purification coupled with Mass Spectrometry (AP-MS) has emerged as the mainstream experimental platform for identifying protein-protein interactions (PPIs) in a high-throughput manner. By combining the specificity of affinity-based protein capture with the sensitivity and resolution of modern mass spectrometry, AP-MS enables the systematic discovery of interaction partners for virtually any protein of interest—without the need for protein-specific antibodies or prior knowledge of interacting partners. The approach has been continuously refined through advances in sample enrichment strategies, separation chromatography methods, and the dramatic improvement of MS resolution and sensitivity, making it one of the most powerful tools in contemporary interactome research.
Unlike traditional Co-IP methods that require a specific antibody for each bait protein, AP-MS employs epitope tags or capture probes to achieve comparable high-throughput screening capability with greater flexibility and lower cost. The bait protein is expressed as a fusion with a short affinity tag (FLAG, HA, V5, or others), immunoprecipitated from cell lysate under gentle conditions that preserve native protein complexes, and the captured interactors are identified by LC-MS/MS. Profacgen provides comprehensive AP-MS services that capture physiologically relevant interactions while minimizing background contamination and protein loss.
Affinity Purification–Mass Spectrometry (AP-MS) is a widely used approach for unbiased mapping of protein–protein interactions (PPIs) under near-native conditions. The method combines affinity-based capture of a tagged bait protein and its interacting partners with high-resolution mass spectrometry for identification, enabling both targeted validation and discovery-based interactome profiling.
In a standard AP-MS workflow, a tagged bait protein is expressed in the host system of choice (e.g., mammalian cells, yeast, or bacteria). Following cell lysis, the bait–protein complexes are captured using tag-specific affinity resins—such as antibody-conjugated beads for FLAG, HA, or c-Myc tags, or streptavidin beads for biotinylated tags. After rigorous washing to remove non-specific binders, the enriched complexes are eluted, digested with trypsin, and analyzed by LC-MS/MS.
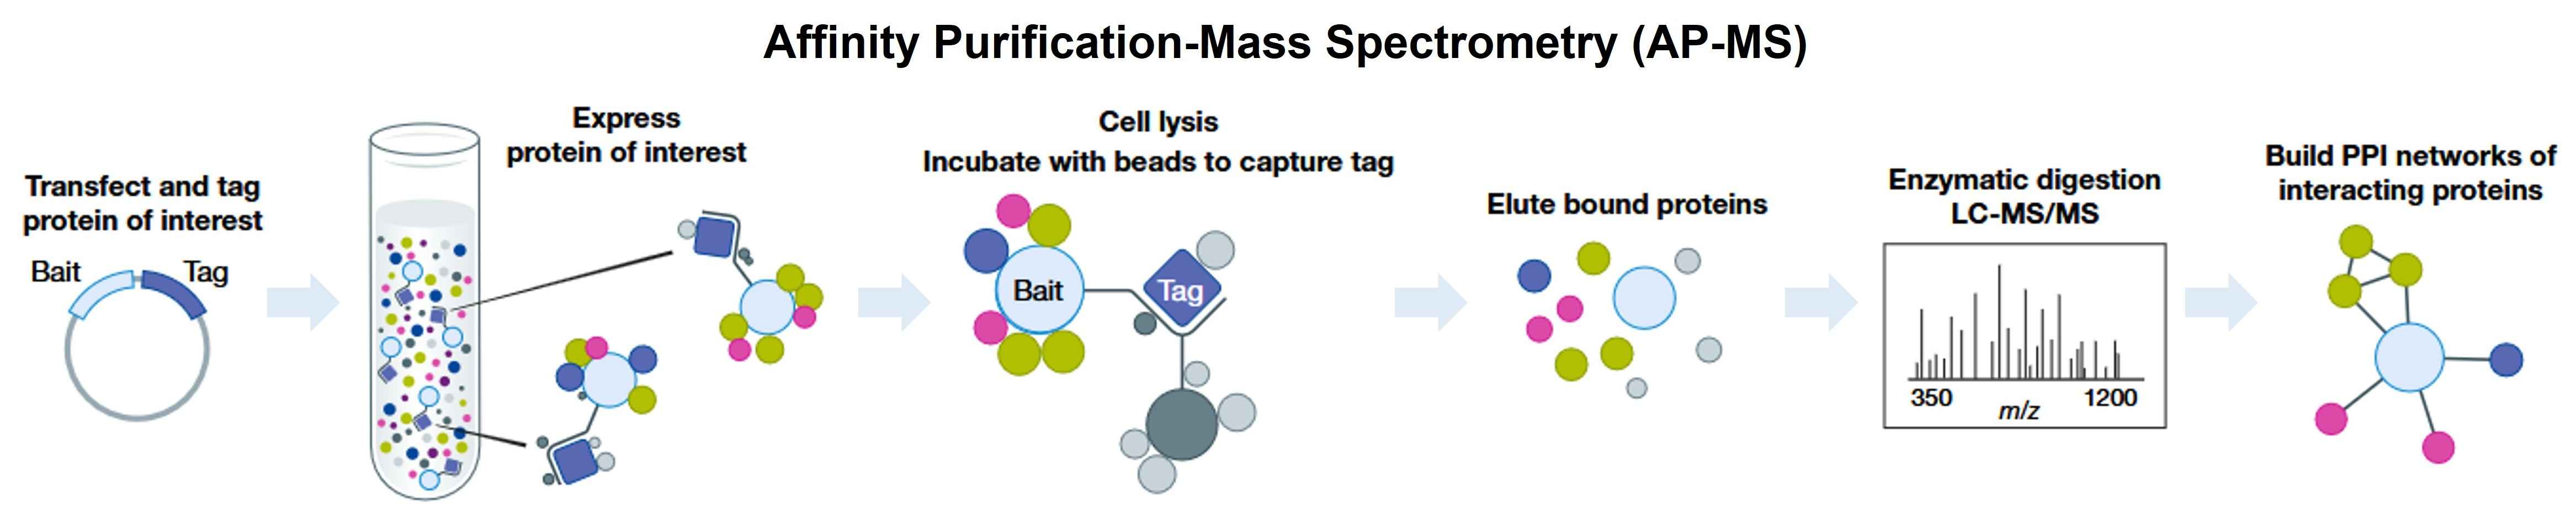 Figure 1. AP-MS workflow. (Adapted from Richards et al., 2021)
A critical challenge in AP-MS is distinguishing true interactors from background contaminants that bind nonspecifically to the resin, tag, or antibody. This is addressed through rigorous experimental design incorporating negative controls (e.g., untagged or empty-vector samples) and quantitative proteomic approaches such as label-free quantification (LFQ) or SILAC. Statistical tools like SAINT or CompPASS are then applied to filter high-confidence interactors from background noise, ensuring biologically meaningful results.
AP-MS is broadly applicable across diverse systems—from bacterial to mammalian cells—and has proven invaluable for mapping signaling networks, characterizing complex compositions, and discovering novel interaction partners. Profacgen's AP-MS platform combines optimized affinity reagents, stringent controls, and state-of-the-art mass spectrometry to provide reliable, publication-ready interactome data.
Physiologically Relevant Interactions
Interactions are captured in the native cellular environment, preserving post-translational modifications, proper folding, and physiologically relevant stoichiometry. This contrasts with in vitro methods that may miss modification-dependent interactions.
No Antibody against Bait Required
Epitope tags eliminate the need to develop or purchase protein-specific antibodies. A single anti-tag antibody captures any tagged bait, enabling rapid deployment for novel targets and dramatically reducing reagent costs.
Minimal Sample Handling
On-bead tryptic digestion or direct elution into MS-compatible buffers minimizes protein loss associated with gel-based separation, increasing sensitivity for low-abundance interactors and weak associations.
Quantitative Specificity
Integration with SILAC, TMT, or label-free quantitation enables statistical discrimination of specific interactors from background contaminants, achieving false discovery rates below 5%.

| Step | Description |
|---|---|
| 1. Vector Design & Cell Line Generation | Bait gene is cloned into an expression vector with N-terminal or C-terminal epitope tag (FLAG, HA, V5, or dual tag). Stable cell lines are generated by lentiviral transduction or transfection with antibiotic selection. |
| 2. Bait Expression Verification | Tag immunoblotting confirms bait expression level and subcellular localization. Flow cytometry or immunofluorescence validates surface or nuclear targeting as appropriate. |
| 3. Affinity Purification | Cells are lysed under conditions preserving native complexes. Anti-tag antibody conjugated to magnetic beads or agarose captures the bait and associated proteins. Stringent washing removes non-specific binders. |
| 4. On-Bead Digestion & LC-MS/MS | Captured proteins are digested with trypsin directly on beads. Peptides are separated by nano-HPLC and analyzed by high-resolution Orbitrap MS with data-dependent or data-independent acquisition. |
| 5. Data Analysis & Bioinformatics | Database searching (MaxQuant, Proteome Discoverer) identifies proteins. Quantitative comparison against empty-vector control distinguishes specific interactors. Functional annotation, GO enrichment, and network visualization complete the analysis. |
To ensure successful project execution, customers are requested to provide:
Upon project completion, Profacgen provides comprehensive deliverables, including:
To complement your protein interaction analysis, explore our comprehensive portfolio of related screening and profiling services.
Background:
A precision oncology program needed to understand the signaling network driven by EML4-ALK, an oncogenic fusion kinase responsible for 3–7% of non-small cell lung cancers. While the kinase domain was well characterized, the N-terminal EML4 portion was thought to mediate oligomerization and subcellular localization through unknown binding partners.
Our Solution:
Profacgen generated a stable HEK293 cell line expressing FLAG-tagged EML4-ALK and performed AP-MS with label-free quantitation. Three biological replicates were analyzed on the Orbitrap Exploris 480 with FAIMS. SAINTexpress scoring was used to filter specific interactors from background, with an FDR threshold of 1%.
Final Results:
AP-MS identified 87 high-confidence EML4-ALK interactors (SAINT probability >0.95), including 14 previously known ALK binding partners. Novel interactors included the microtubule-associated proteins MAP2, MAP4, and KIF5B—explaining the EML4-mediated perinuclear localization of the fusion kinase. Disruption of the ALK-MAP4 interaction by a competitive peptide reduced oncogenic signaling (p-STAT3) by 60% and sensitized cells to alectinib. The complete interactome data supported a patent filing on novel combination therapy strategies.
Background:
An endocrinology research group studying tamoxifen resistance in breast cancer observed that resistant cells maintained estrogen receptor α (ERα) expression and transcriptional activity despite the presence of the drug. They hypothesized that resistance involved recruitment of novel coactivator proteins that bypassed the tamoxifen block.
Our Solution:
Profacgen performed SILAC-based AP-MS of FLAG-ERα in MCF-7 cells cultured in heavy (tamoxifen-resistant) and light (tamoxifen-sensitive) SILAC media. ERα was immunoprecipitated from nuclear extracts, and interactors were quantified by the H/L ratio in the MS analysis. Three independent biological replicates provided statistical power.
Final Results:
Comparative AP-MS identified 23 proteins with >3-fold increased association with ERα in resistant cells. The most significant was SRC-3 (NCOA3), a known coactivator whose recruitment increased 8-fold. Unexpectedly, the transcription factor FOXA1 showed a 5-fold increase, and ChIP-seq confirmed FOXA1 co-occupancy with ERα at resistance-associated enhancers. A dual SRC-3/FOXA1 inhibitor developed based on these findings restored tamoxifen sensitivity in resistant xenografts, providing a translational path to overcome clinical resistance.
References:
Fill out this form and one of our experts will respond to you within one business day.