We use cookies to understand how you use our site and to improve the overall user experience. This includes personalizing content and advertising. Read our
Privacy Policy
At Profacgen, our 3D-QSAR service provides a powerful computational framework for establishing quantitative relationships between the three-dimensional structural features of small molecules and their biological activities. As an extension to classical 2D-QSAR approaches, 3D-QSAR exploits spatial molecular properties—steric fields, electrostatic potentials, and hydrophobic distributions—to build predictive models that guide medicinal chemistry decisions. Our workflow integrates force field calculations on training sets with experimentally measured activities, followed by feature extraction, machine learning model construction, and rigorous validation.
Why 3D-QSAR Matters
The research and development of therapeutic drugs remains a costly and time-intensive endeavor. Computer-aided drug design (CADD) has emerged as an indispensable strategy for accelerating lead discovery and optimization, and Quantitative Structure–Activity Relationship (QSAR) modeling sits at its core.
While classical QSAR approaches pioneered by Hansch and Free-Wilson rely on physicochemical descriptors derived from 2D molecular graphs, 3D-QSAR advances this paradigm by incorporating the three-dimensional geometry of ligands. By mapping molecular interaction fields onto a regular grid surrounding aligned molecules, 3D-QSAR captures steric, electrostatic, and hydrophobic contributions that are often invisible to descriptor-based methods. This approach enables researchers to:
Identify key structural determinants governing biological activity at atomic resolution
Predict activities of untested compounds before synthesis, reducing experimental burden
Rationalize structure–activity trends within congeneric series for lead optimization
Guide de novo design by revealing favorable and unfavorable regions in chemical space
Our 3D-QSAR Service Offerings
Profacgen delivers an end-to-end 3D-QSAR pipeline tailored to your project's objectives and data availability. Our comprehensive service covers every stage from data preparation through model deployment:
Service Component
Description
Data Curation & Biological Activity Analysis
Compilation and standardization of training set compounds with experimental activity values
Assessment of activity distribution, redundancy, and applicability domain coverage
Guidance on dataset selection, outlier identification, and endpoint definition
Molecular Alignment & Conformational Analysis
Systematic or receptor-based alignment strategies for optimal field superposition
Bioactive conformation determination using docking, pharmacophore, or systematic search methods
Handling of molecular flexibility and tautomeric/protomeric states
Field Calculation & Model Building
Computation of steric (Lennard-Jones), electrostatic (Coulombic), and hydrophobic interaction fields
Application of robust chemometric methods: PLS, G/PLS, ANN, and machine learning algorithms
Optimal grid spacing, probe atom selection, and energy cutoff tuning
Model Validation & Performance Assessment
Internal cross-validation (leave-one-out, leave-group-out, k-fold) with q2 reporting
External test-set validation with predictive r2 and RMSE metrics
Y-randomization tests to exclude chance correlation
Applicability domain estimation via leverage distance or similarity thresholds
Model Interpretation & Lead Optimization Support
Contour map visualization of steric/electrostatic/hydrophobic favorability regions
Structural modification recommendations based on field contribution analysis
Activity prediction for virtual libraries or newly designed analogs
Typical 3D-QSAR Workflow
Figure 1. Structure- and ligand-based 3D-QSAR protocol workflow.
Key Advantages of Our 3D-QSAR Service
Automated, Reproducible Pipeline: Our one-step 3D-QSAR workflow ensures consistency across projects while allowing full customization of parameters, alignment strategies, and modeling algorithms.
Powerful Statistical Foundation: We employ state-of-the-art chemometric techniques—including partial least squares (PLS), genetic algorithm/PLS hybrid methods, and modern machine learning approaches—to deliver robust, validated models.
Lead Optimization Focus: Beyond prediction, our contour map analysis directly translates into actionable SAR insights, enabling rational design of next-generation analogs with improved potency and selectivity.
Seamless Integration: Results can be fed into downstream workflows including virtual screening, pharmacophore modeling, molecular docking, and de novo design campaigns.
Expert Consultation: Our scientists provide guidance on data selection, endpoint appropriateness, model interpretation, and integration with complementary CADD approaches.
Representative Case Studies
Case 1: Kinase Inhibitor Optimization Through CoMFA Modeling
Background:
A drug discovery program sought to optimize a series of ATP-competitive kinase inhibitors that had reached a potency plateau. The team possessed activity data for ~80 analogs spanning diverse substitution patterns but lacked a clear rationale for further structural modifications.
Our Solution:
We constructed a Comparative Molecular Field Analysis (CoMFA) model using receptor-based alignment derived from a co-crystal structure of a close analogue. Field calculations employed standard probes (sp3 carbon, H+) with optimal grid resolution. The final PLS model achieved a cross-validated q2 of 0.68 and external predictive r2 of 0.72.
Final Results:
Contour maps revealed previously unexplored regions where bulky substituents were predicted to enhance affinity. Based on these insights, the client designed 12 new compounds; 8 showed improved activity, with the most potent achieving a 5-fold IC50 reduction over the series best-in-class.
Case 2: Predictive 3D-QSAR Model for GPCR Ligand Design
Background:
A biotech company required a predictive model to prioritize synthesis targets for a novel GPCR ligand series. The existing dataset was modest (~50 compounds), and the binding site lacked high-resolution structural information.
Our Solution:
We implemented a ligand-based 3D-QSAR strategy using Topomer CoMFA for rapid alignment-independent modeling, complemented by a pharmacophore-guided alignment approach as a secondary validation. Both models underwent rigorous internal (LOO-CV, 5-fold CV) and external (20% holdout) validation, along with Y-randomization testing.
Final Results:
The consensus model achieved robust predictive statistics (q2 = 0.61, rpred2 = 0.65). The client applied it to screen an in-house virtual library of 500+ candidates, identifying 15 high-priority synthetic targets. Subsequent synthesis and testing confirmed the predicted activity trend for 12 of 15 prioritized compounds.
Q: What is the difference between 3D-QSAR and classical 2D-QSAR?
A: Classical 2D-QSAR uses molecular descriptors derived from 2D structural formulas (e.g., logP, molar refractivity, topological indices) to correlate with biological activity. 3D-QSAR extends this by calculating three-dimensional molecular interaction fields (steric, electrostatic, hydrophobic) around spatially aligned molecules, capturing spatially resolved structure–activity information that 2D descriptors cannot represent.
Q: How many compounds are needed to build a reliable 3D-QSAR model?
A: While there is no absolute minimum, a robust 3D-QSAR model typically requires at least 20–30 structurally diverse compounds with reliably measured activity data covering a reasonable dynamic range (ideally >2 log units). Smaller datasets may still yield useful models but require careful validation and narrower applicability domains. Larger datasets (>50 compounds) generally produce more stable and generalizable models.
Q: What types of biological endpoints can be modeled with 3D-QSAR?
A: 3D-QSAR is applicable to any continuous quantitative endpoint, including binding affinities (Kd, Ki, IC50, EC50), inhibition constants, rate constants, ADMET properties (solubility, permeability, clearance), and toxicity measures. It is not suitable for categorical or binary classification tasks without adaptation.
Q: How do you handle molecular alignment in 3D-QSAR?
A: We support multiple alignment strategies depending on available data: (1) Ligand-based alignment using common substructure or pharmacophore features when no receptor structure exists; (2) Receptor-based alignment docking all ligands into the binding pocket for pose-driven superposition when a co-crystal structure or homology model is available; and (3) Alignment-free methods such as Topomer CoMFA that avoid the alignment problem altogether by using predefined fragment templates.
Q: Can 3D-QSAR results be integrated with virtual screening or docking studies?
A: Absolutely. 3D-QSAR models serve as powerful rescoring or post-processing tools for virtual screening hits. Docking poses can be evaluated by the 3D-QSAR model to rank compounds not only by docking score but also by predicted bioactivity. Conversely, pharmacophore constraints derived from 3D-QSAR contour maps can be used to filter docking libraries before scoring, improving hit rates and focusing resources on the most promising candidates.
Q: How is model quality assessed and reported?
A: Every 3D-QSAR model undergoes comprehensive validation. Internal performance is assessed by cross-validated q2 (typically >0.5 indicates significance), standard error of estimate (SEE), and F-statistic. External predictivity is tested on a held-out test set with predictive r2. Y-randomization (scrambling activity values) confirms the model is not due to chance correlation. Applicability domain boundaries define where predictions remain reliable. Full documentation includes all statistical parameters, contour maps, and interpretation guidelines.
References:
Liu G, Wan Y, Wang W, Fang S, Gu S, Ju X. Docking-based 3D-QSAR and pharmacophore studies on diarylpyrimidines as non-nucleoside inhibitors of HIV-1 reverse transcriptase. Mol Divers. 2019;23(1):107-121. doi:10.1007/s11030-018-9860-1
Online Inquiry
Fill out this form and one of our experts will respond to you within one business day.

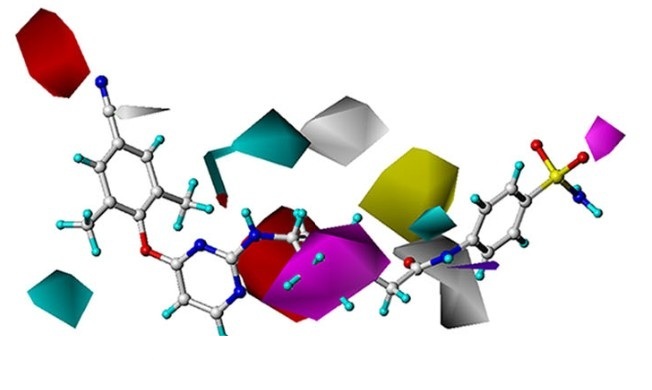
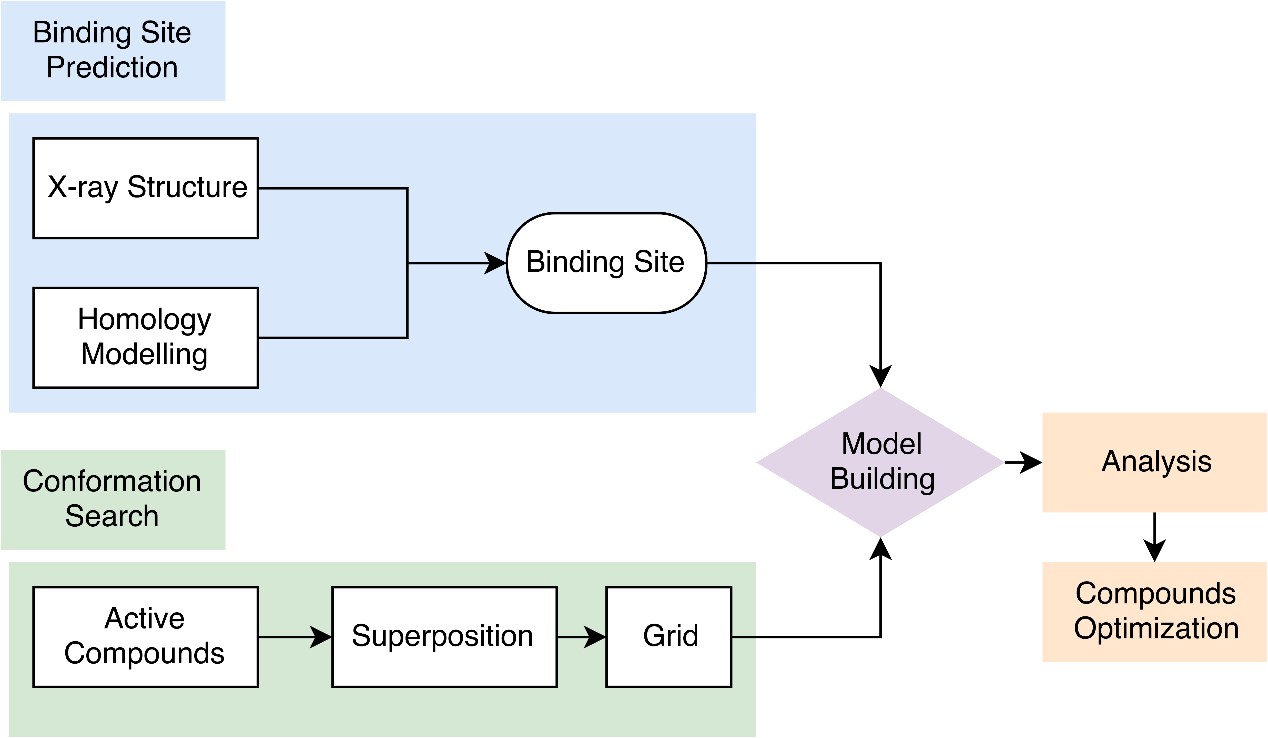 Figure 1. Structure- and ligand-based 3D-QSAR protocol workflow.