We use cookies to understand how you use our site and to improve the overall user experience. This includes personalizing content and advertising. Read our
Privacy Policy
At Profacgen, our Protein Quantum Dot Labeling Service provides precise bioconjugation of proteins, antibodies, and peptides to colloidal semiconductor nanocrystals for advanced imaging, sensing, and diagnostic applications. Quantum dots (QDs) are fluorescent nanocrystals typically 2–10 nm in diameter, composed of an inorganic semiconductor core (commonly CdSe, CdTe, or InP) coated with a wider-bandgap shell (ZnS) to enhance quantum yield and photostability. Their unique optical properties—narrow emission bandwidths, size-tunable emission across the visible and near-infrared spectrum, exceptional photostability, and large Stokes shifts—make QDs superior fluorophores for multiplexed imaging, single-particle tracking, and quantitative biosensing.
Unlike conventional organic fluorophores that suffer from rapid photobleaching and broad emission tails, QDs maintain constant fluorescence intensity over extended imaging periods and enable simultaneous detection of multiple targets with minimal spectral overlap. Profacgen offers a comprehensive QD labeling platform encompassing QD selection, surface functionalization, protein conjugation via covalent or affinity-driven chemistries, purification of monovalent conjugates, and full analytical characterization to ensure optimal performance in your specific application.
Background: Quantum Dot Photophysics and Surface Chemistry
Quantum dots exhibit size-tunable photoluminescence due to quantum confinement: when the nanocrystal diameter falls below the exciton Bohr radius (~5.6 nm for CdSe), the bandgap increases with decreasing size, enabling emission from ~520 nm (blue) to >800 nm (NIR). Emission peaks are narrow (FWHM 25–40 nm), allowing 5–8 colors to be resolved simultaneously under single-wavelength excitation with minimal crosstalk.
The CdSe/ZnS core/shell structure (1–3 ML ZnS) forms a type-I heterostructure that confines carriers to the core, boosting quantum yield (30–90%) while the shell provides chemical stability. For biological use, the hydrophobic TOPO-coated surface is replaced with hydrophilic, functionalized coatings.
Surface functionalization strategies determine the biocompatibility, colloidal stability, and conjugation chemistry available for QD-protein coupling. Common approaches include:
Ligand exchange with thiol-containing hydrophilic ligands (mercaptoacetic acid, dihydrolipoic acid) exposing carboxyl or amine groups;
Silica encapsulation forming a silica shell with surface silanol groups for further functionalization;
Polymer coating with amphiphilic polymers that intercalate with native hydrophobic ligands while exposing hydrophilic and reactive groups;
Phospholipid micelle encapsulation for biocompatible, non-fouling surfaces. Profacgen selects the optimal surface chemistry based on the target protein, application environment, and downstream conjugation requirements.
Figure 1. (A) Schematic illustration of the direct encapsulation of hydrophobic QDs. (B) Schematic depiction of three-step encapsulation of QDs undergoing a radical initiated reaction with block polymers. (Zhou et al., 2017)
These surface engineering strategies have enabled the successful application of QDs in cellular and tissue imaging. QDs functionalized with appropriate surface coatings exhibit bright, photostable fluorescence in biological specimens, with emission colors that can be multiplexed to resolve multiple targets simultaneously. The high quantum yield and narrow emission spectra allow clear visualization of subcellular structures and tissue architecture, while the resistance to photobleaching supports long-term imaging studies. Profacgen leverages these advanced QD surface chemistries to provide customized QD-protein conjugates, optimized for specific imaging and labeling applications.
Figure 2. Fluorescence micrographs of QD-stained cells and tissues. (Zhou et al., 2015)
Our Quantum Dot Labeling Services
Profacgen offers a comprehensive QD bioconjugation platform with multiple coupling strategies:
Covalent EDC/NHS Coupling
Carbodiimide-mediated amide bond formation between carboxyl-functionalized QDs and amine groups on the target protein. The most widely used method, offering robust, stable conjugation.
Carboxyl-QDs activated with EDC and sulfo-NHS
Coupling to lysine residues or N-terminal amines at pH 7.0–7.5
Stable amide linkage resistant to physiological conditions
Typinal conjugation efficiency: 60–90%
Best for: antibodies, streptavidin, proteins with available amines
Thiol-Directed Coupling
Direct binding of thiol-containing proteins or peptides to the ZnS shell via sulfur-zinc coordination, or crosslinking via heterobifunctional thiol-reactive linkers.
Direct: cysteine thiols or polyhistidine residues bind ZnS surface
Linker-mediated: SPDP, sulfo-SMCC, or SATA for controlled orientation
Mild reaction conditions (pH 6.5–7.5) preserve protein activity
Best for: Fab fragments, thiol-engineered proteins, His-tagged proteins
Self-Assembly via Engineered Tags
Non-covalent conjugation through high-affinity protein-ligand interactions, enabling reversible labeling and defined QD:protein stoichiometry.
Streptavidin-QD + biotinylated protein (KD ~10-15 M)
Protein A/G-QD + antibody Fc binding
NTA-Ni2+-QD + His6-tagged protein
Defined valency control: monovalent to decavalent conjugates
Click Chemistry Conjugation
Bioorthogonal coupling strategies for site-specific QD labeling without affecting native protein functional groups.
SPAAC: azide-functionalized QD + DBCO-modified protein
CuAAC: azide-QD + alkyne-protein (in vitro)
Tetrazine ligation: TCO-QD + tetrazine-protein
Site-specific, chemoselective, high yield (>90%)
QD Specifications and Characterization
Core materials: CdSe/ZnS (most common), CdTe/ZnS (red/NIR emission), InP/ZnS (cadmium-free), PbS (NIR-II, 1000–1600 nm emission for deep tissue imaging)
Emission range: 520 nm (green) to 800+ nm (NIR); FWHM 25–40 nm; excitation with any wavelength below emission peak (typically 365–405 nm UV or 488 nm)
Quantum yield: 40–90% depending on core/shell quality and surface passivation
Analytical characterization: UV-Vis absorption and fluorescence spectroscopy; DLS and zeta potential for hydrodynamic size and colloidal stability; TEM for core size and morphology; agarose gel electrophoresis for conjugate purity; MALDI-TOF or SDS-PAGE for protein:QD stoichiometry
Applications
Multiplexed cellular and tissue imaging: Simultaneous detection of 5–8 targets in a single sample with minimal spectral overlap; ideal for immunofluorescence, FISH, and tissue microarrays
Single-molecule and single-particle tracking: Exceptional photostability enables tracking of individual QD-labeled proteins for minutes to hours without photobleaching
In vivo imaging and image-guided surgery: NIR-emitting QDs (700–900 nm) enable deep tissue penetration with high signal-to-background ratios
Flow cytometry and bead-based assays: QD-encoded microspheres enable high-dimensional multiplexing (>100-plex) for cytokine profiling and biomarker detection
Drug discovery screening: QD-based fluorescence assays for high-throughput screening of protein-protein and protein-ligand interactions
Representative Case Studies
Case Study 1: Five-Color QD Immunofluorescence for Tumor Immune Microenvironment Mapping
Background:
A cancer immunology group needed to simultaneously visualize five immune cell markers (CD3, CD4, CD8, FoxP3, PD-1) plus a tumor marker (pan-cytokeratin) in FFPE tumor sections to characterize the immune infiltrate.
Approach:
Profacgen conjugated six spectrally distinct CdSe/ZnS QDs (525, 565, 605, 655, 705, and 800 nm emission) to the corresponding primary antibodies using EDC/NHS coupling. All six QD-antibody conjugates were applied simultaneously to deparaffinized tumor sections and imaged using a multispectral fluorescence microscope with linear unmixing.
Outcome:
Linear unmixing successfully resolved all six QD signals with <2% spectral crosstalk, compared to >15% crosstalk with the group's previous organic dye panel. The narrow QD emission bands enabled clear separation of all markers in a single imaging session. Quantitative spatial analysis revealed three distinct immune microenvironment patterns correlated with patient response to checkpoint inhibitor therapy, providing a novel predictive biomarker for patient stratification.
Case Study 2: Single-QD Tracking of Receptor Diffusion in Live Neurons
Background:
A neuroscience laboratory needed to track individual AMPA receptor trajectories on live neuronal membranes with sufficient temporal resolution to resolve transient confinement in synaptic nanodomains.
Approach:
Profacgen conjugated 655 nm-emitting QDs to anti-GluA1 Fab fragments using a sulfo-SMCC heterobifunctional linker, yielding monovalent QD-Fab conjugates. Primary hippocampal neurons (DIV 14) were labeled with QD-Fab at 0.1 nM for 5 minutes, washed, and imaged by total internal reflection fluorescence (TIRF) microscopy at 30 Hz.
Outcome:
Individual QD-Fab conjugates were tracked for up to 20 minutes without detectable photobleaching, compared to <30 seconds for organic dye-labeled Fab. Trajectory analysis revealed three distinct diffusion states: fast free diffusion (D = 0.45 μm²/s), slow surface exploration (D = 0.08 μm²/s), and confined nanodomain trapping (D = 0.01 μm²/s). The QD's photostability enabled statistical analysis of >10,000 trajectories, revealing that nanodomain confinement was dependent on the GluA1 subunit's C-terminal PDZ-binding motif—a finding that required the extended observation window uniquely provided by QD labeling.
Q: What are the advantages of quantum dots over organic fluorophores?
A: Quantum dots offer five key advantages: (1) exceptional photostability—QD fluorescence persists for hours under continuous excitation, whereas organic dyes photobleach within seconds to minutes; (2) narrow, symmetric emission spectra (FWHM 25–40 nm) enabling simultaneous multiplexing of 5–8 colors with minimal spectral overlap; (3) large Stokes shifts (>100 nm) reducing excitation scatter background; (4) size-tunable emission across the visible and NIR spectrum using a single excitation source; and (5) higher brightness due to larger absorption cross-sections and superior quantum yields compared to most organic dyes in the red/NIR region.
Q: Are cadmium-based QDs safe for biological applications?
A: When properly encapsulated with a robust ZnS shell and hydrophilic surface coating, CdSe/ZnS QDs exhibit minimal cadmium leaching and are widely used for in vitro and short-term in vivo imaging applications. The ZnS shell provides a physical barrier preventing Cd2+ release under physiological conditions. For long-term in vivo or clinical applications, we offer cadmium-free alternatives including InP/ZnS QDs (visible emission) and PbS QDs (NIR-II emission for deep tissue imaging) that eliminate heavy metal toxicity concerns entirely. We provide guidance on QD selection based on your specific safety and regulatory requirements.
Q: How do you control the number of proteins per QD (valency)?
A: Valency is controlled through the conjugation chemistry and stoichiometry. For covalent coupling, the protein:QD molar ratio is titrated to favor single-protein attachment (typically 1:1 to 5:1 protein:QD). For self-assembly approaches (streptavidin-biotin, His-tag-NTA), valency is precisely defined by the number of binding sites on the QD surface. Monovalent QD conjugates are purified from multi-valent species by size-exclusion chromatography or gel electrophoresis. We characterize the average valency of each batch by MALDI-TOF, SDS-PAGE, or analytical SEC and provide monodisperse, monovalent conjugates when required for single-particle applications.
Q: What is the typical brightness comparison between QDs and organic dyes?
A: QD brightness depends on the extinction coefficient and quantum yield. For a typical 605 nm CdSe/ZnS QD (quantum yield ~70%, extinction coefficient ~1.2 × 10⁶ M-1cm-1 at 350 nm), the brightness is approximately 10–100× higher than Alexa Fluor 594 under UV or 488 nm excitation. This advantage increases in the red and NIR spectral regions where organic dyes have lower quantum yields. However, QDs are less bright under direct 488 nm excitation compared to fluorescein or GFP because their molar extinction coefficient at 488 nm is lower than their peak UV absorption. Optimal excitation is typically at 350–405 nm for maximal QD brightness.
Q: What are the typical timelines for QD-protein conjugation projects?
A: A standard QD labeling project proceeds as follows: QD selection and surface functionalization (1 week if using catalog QDs, 2–3 weeks for custom synthesis), protein conjugation optimization (1 week), scale-up conjugation and purification (3–5 days), and analytical characterization (3–5 days)—total 3–5 weeks. For clients providing both QDs and proteins, the conjugation and characterization portion can be completed in 1–2 weeks. Rush turnaround (1 week) is available for qualified projects using standard catalog QDs and established conjugation protocols.
References:
Medintz IL, Uyeda HT, Goldman ER, Mattoussi H. Quantum dot bioconjugates for imaging, labelling and sensing. Nature Mater. 2005;4(6):435-446. doi:10.1038/nmat1390
Zhou J, Liu Y, Tang J, Tang W. Surface ligands engineering of semiconductor quantum dots for chemosensory and biological applications. Materials Today. 2017;20(7):360-376. doi:10.1016/j.mattod.2017.02.006
Zhao MX, Zeng EZ. Application of functional quantum dot nanoparticles as fluorescence probes in cell labeling and tumor diagnostic imaging. Nanoscale Res Lett. 2015;10(1):171. doi:10.1186/s11671-015-0873-8
Online Inquiry
Fill out this form and one of our experts will respond to you within one business day.

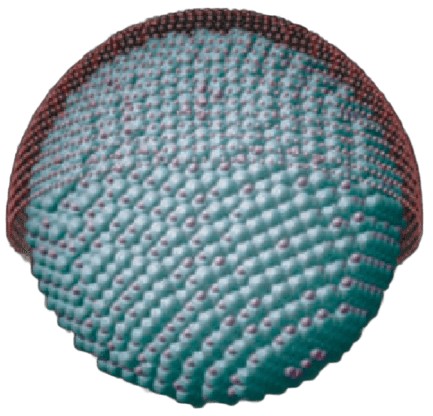
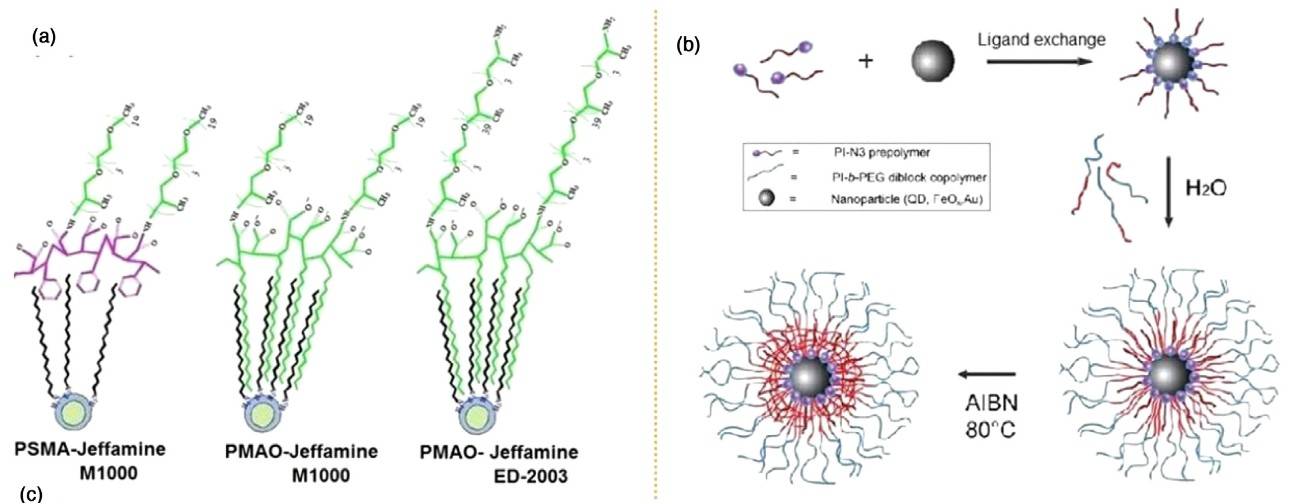 Figure 1. (A) Schematic illustration of the direct encapsulation of hydrophobic QDs. (B) Schematic depiction of three-step encapsulation of QDs undergoing a radical initiated reaction with block polymers. (Zhou et al., 2017)
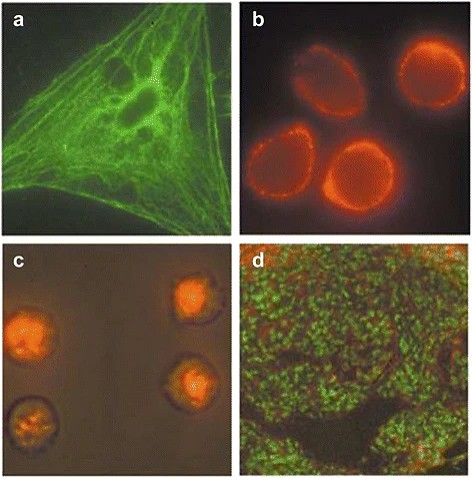 Figure 2. Fluorescence micrographs of QD-stained cells and tissues. (Zhou et al., 2015)