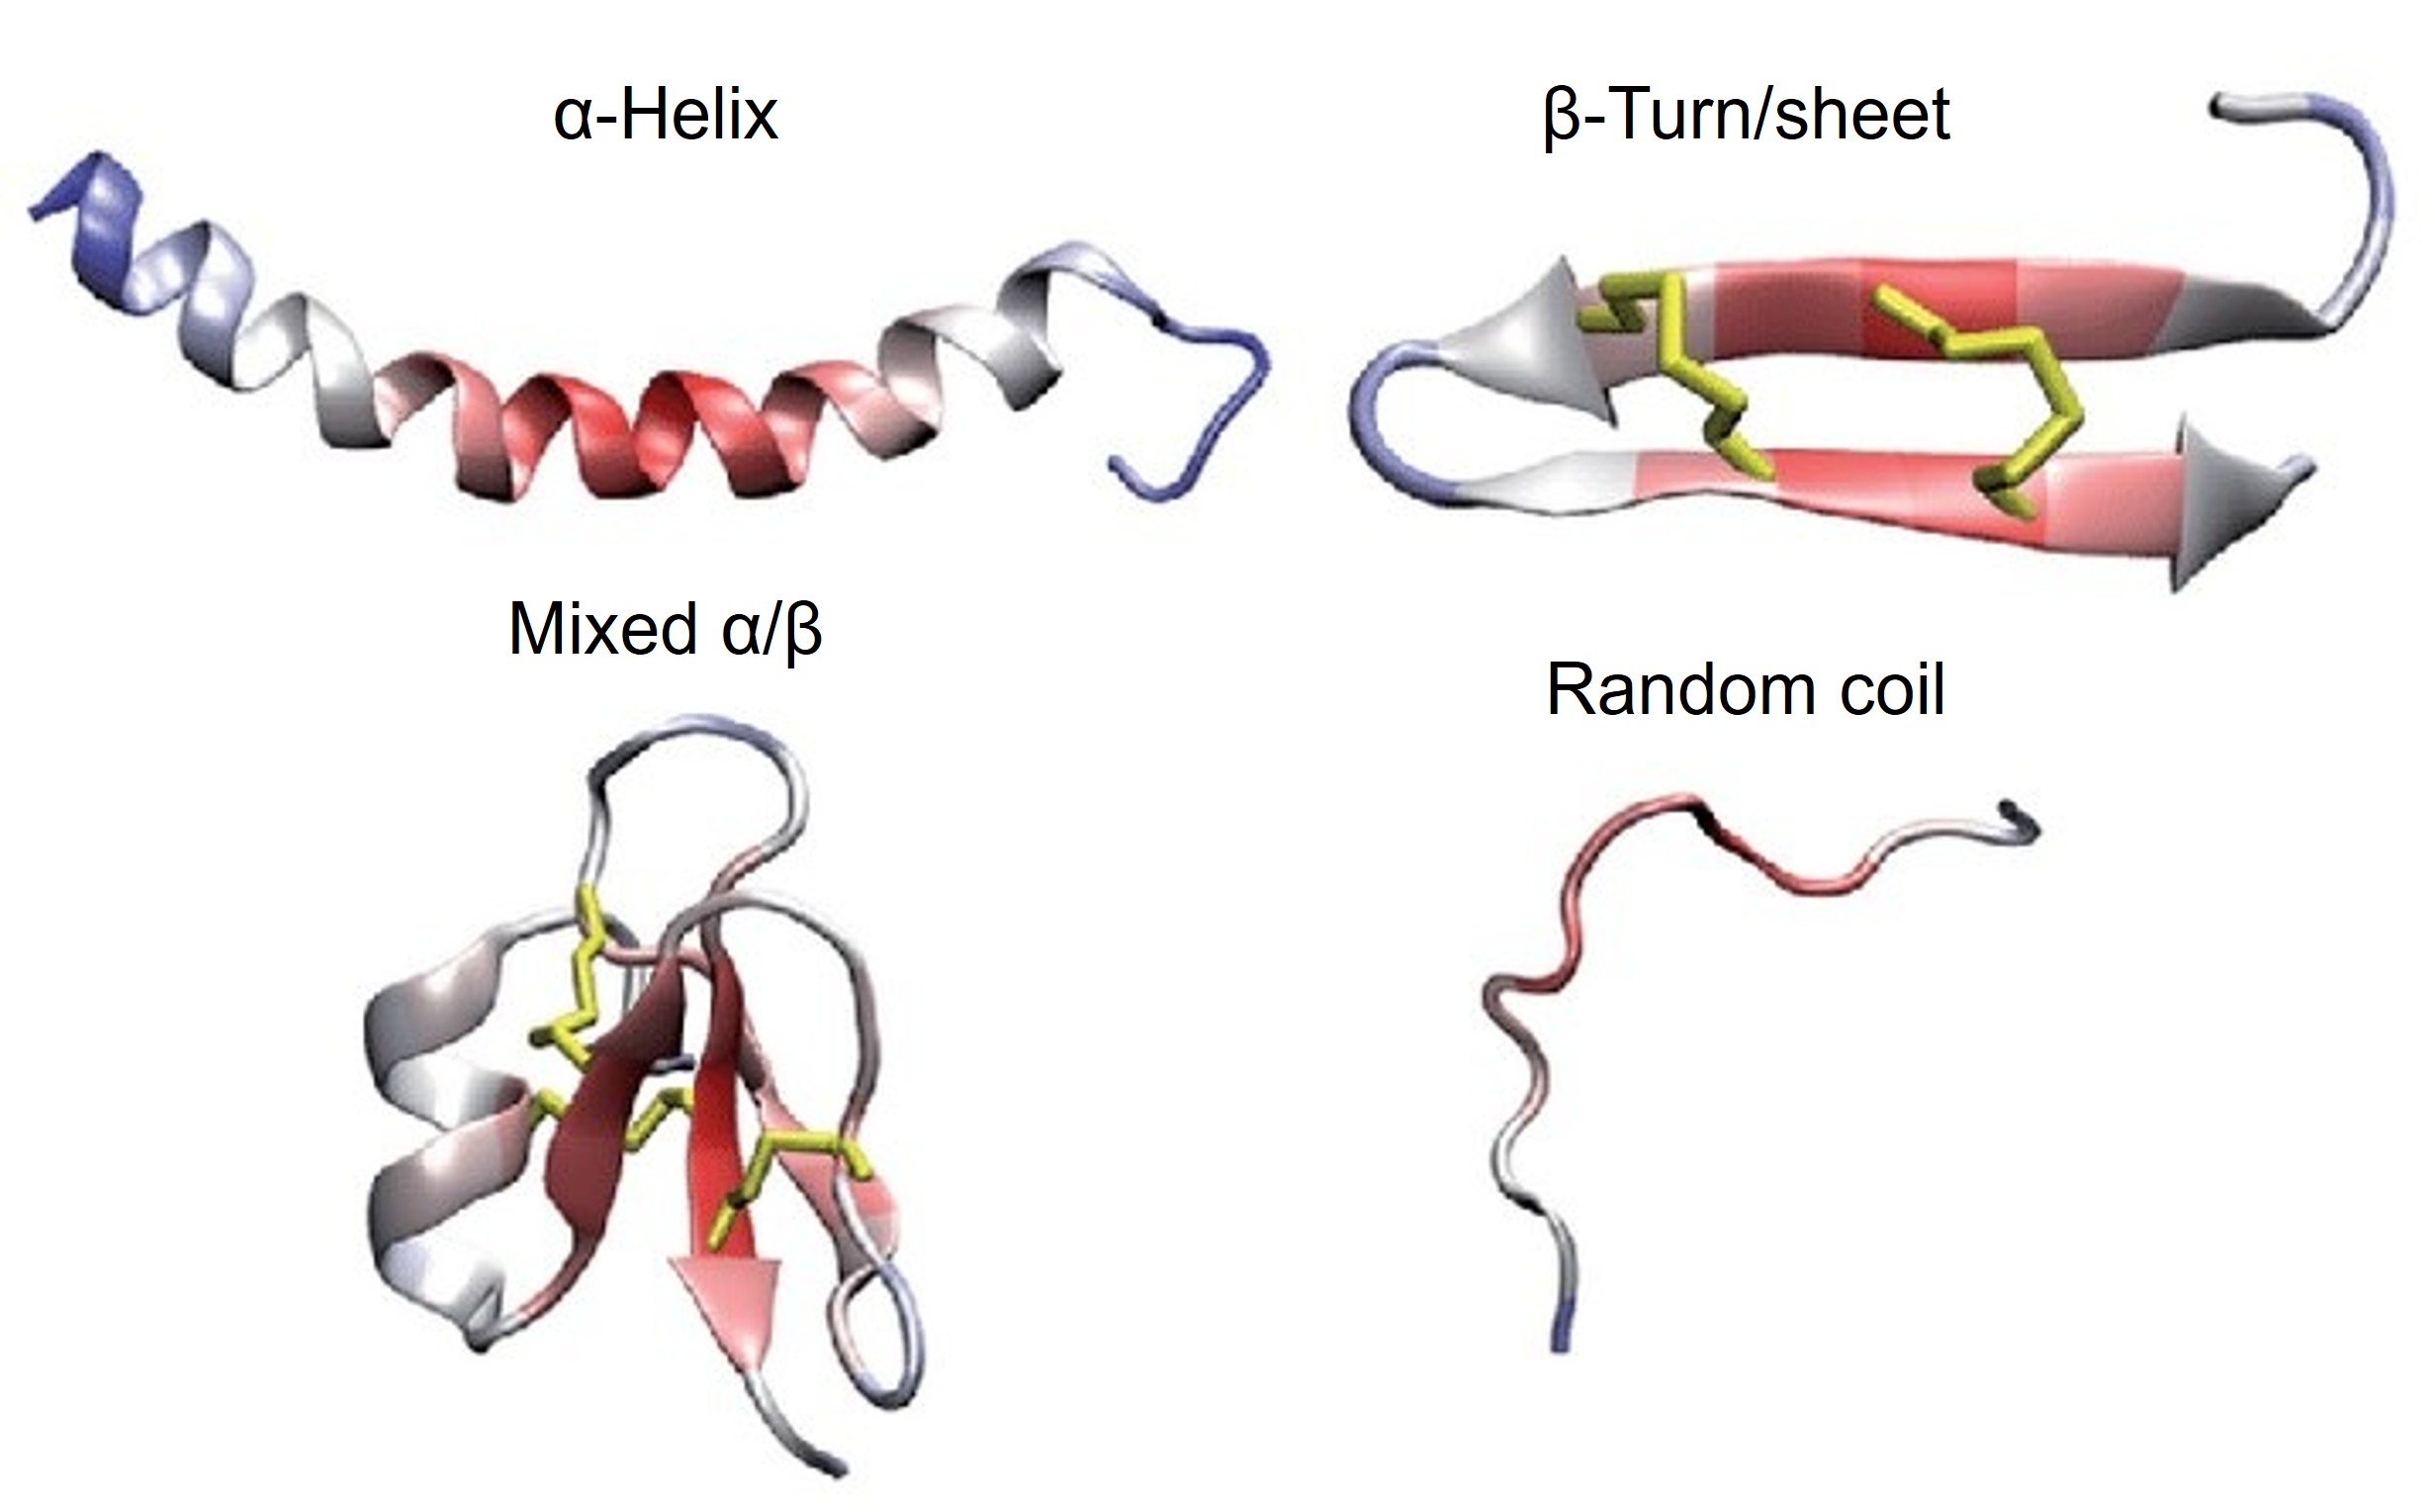
 Figure 1. Secondary structure elements.
Profacgen's Secondary Structure Characterization service delivers precise, quantitative assessment of protein backbone conformation by orthogonal spectroscopic techniques, providing the structural fingerprint required for identity confirmation, comparability assessment, formulation development, and regulatory compliance.
Secondary structure—the local spatial arrangement of the polypeptide backbone into α-helices, β-sheets, turns, and unordered regions—directly influences protein stability, solubility, aggregation propensity, and biological activity. Even subtle shifts in secondary structure content can signal partial unfolding, misfolding, or formulation-induced conformational changes that compromise therapeutic performance. Rigorous secondary structure characterization is therefore essential for batch release, biosimilar comparability, forced degradation studies, and process change evaluation.
The secondary structure content of a protein therapeutic is a critical quality attribute (CQA) recognized by regulatory agencies worldwide. ICH Q6B and FDA guidance emphasize the need for biophysical data that confirm the product adopts its intended conformation and maintains structural consistency across manufacturing batches, scales, and shelf-life conditions.
Circular dichroism (CD) and Fourier-transform infrared (FTIR) spectroscopy are the two principal orthogonal techniques for secondary structure quantification. CD exploits the differential absorption of left- and right-circularly polarized light by chiral chromophores in the peptide backbone, while FTIR probes amide bond vibrations sensitive to hydrogen bonding patterns. Together, these methods provide complementary, mutually reinforcing evidence of structural integrity that satisfies regulatory expectations and supports robust CMC decision-making.
These analyses establish a quantitative structural baseline that enables sensitive detection of conformational drift and supports data-driven formulation and process optimization.
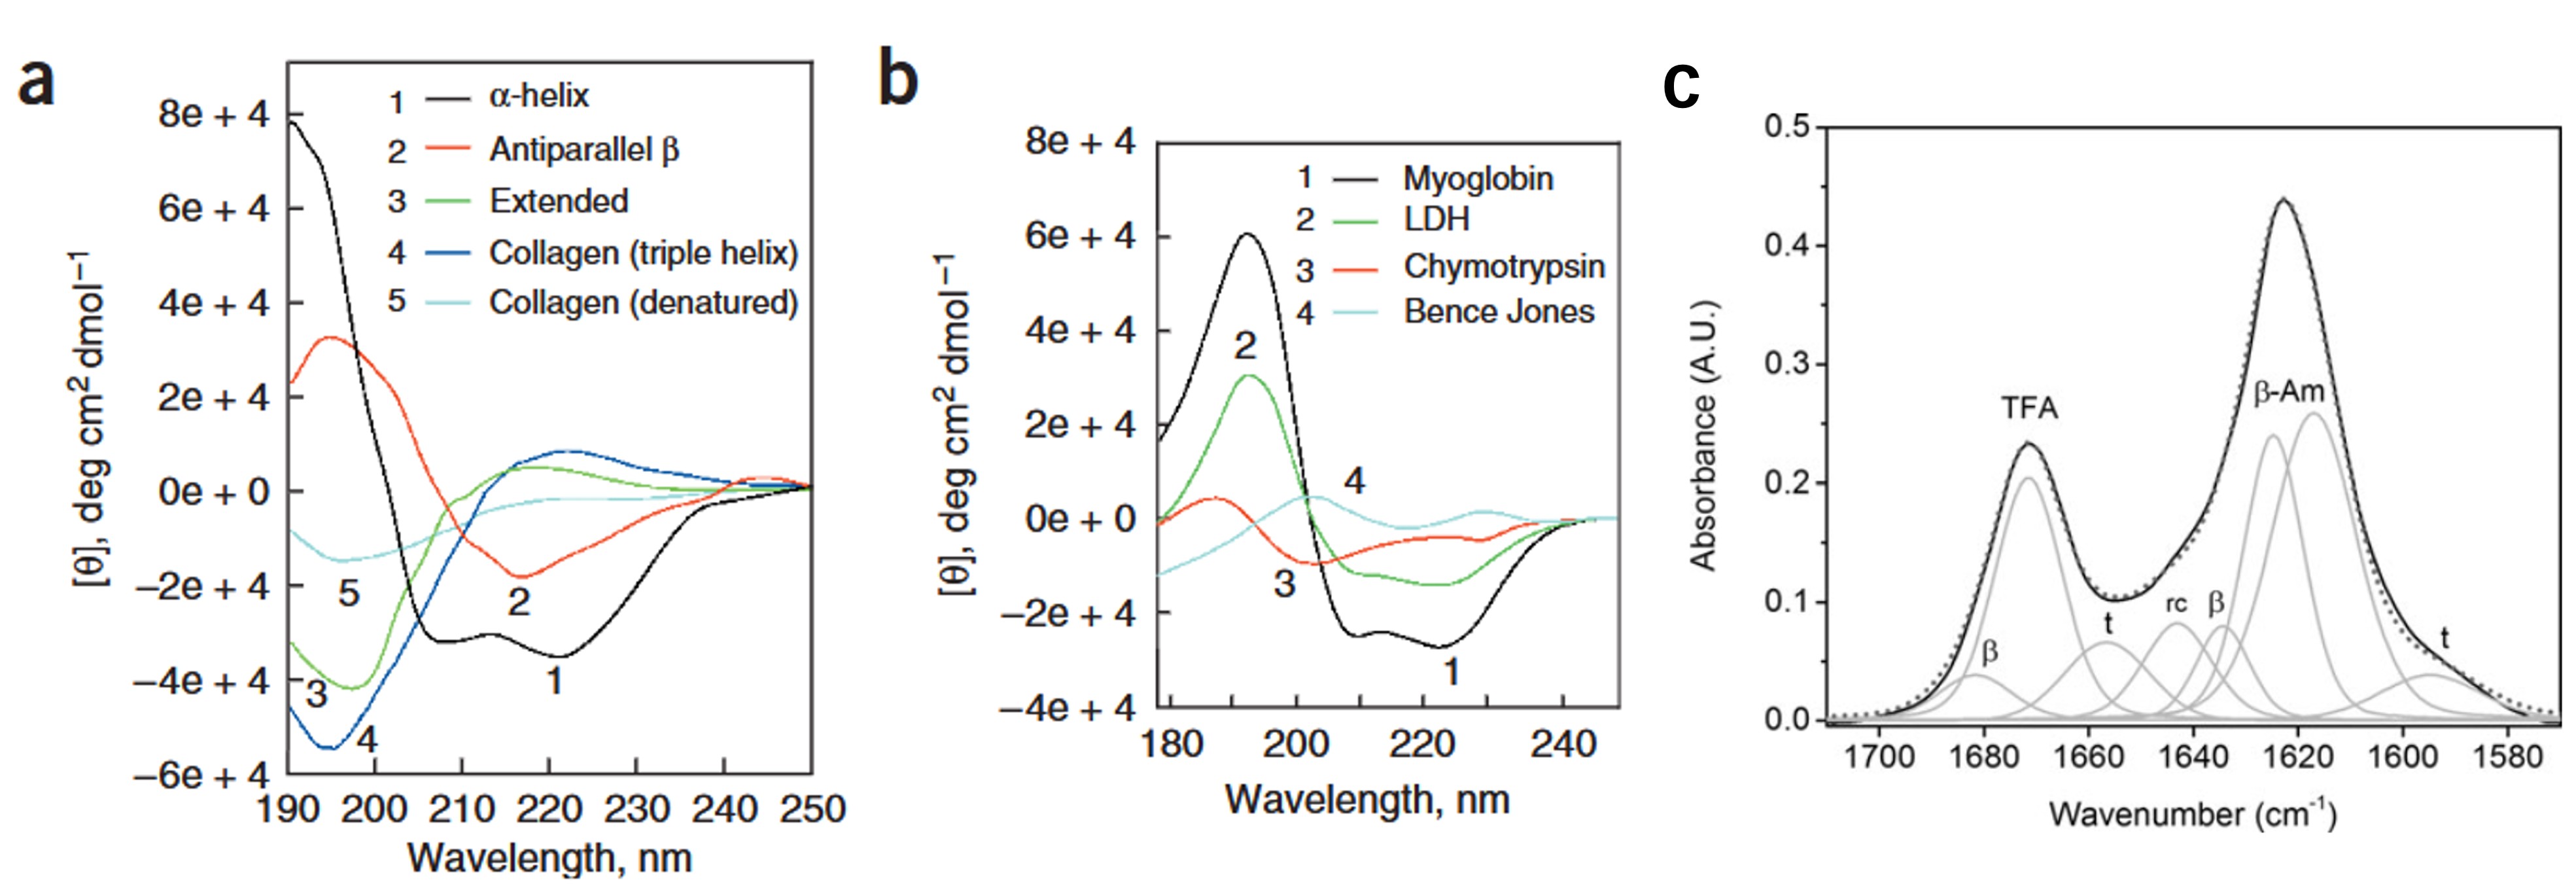 Figure 2. Secondary structure characterization by circular dichroism and FTIR. (a and b) CD spectra of polypeptides and proteins with representative secondary structures. (Zhang et al., 2014) (c) Secondary structure analysis of the R2T peptide using FTIR. (Lembr et al., 2014)
Our Secondary Structure Characterization platform integrates orthogonal spectroscopic methodologies to deliver definitive, stage-appropriate structural evidence. We tailor technique selection, experimental conditions, and data interpretation to your specific molecule, regulatory pathway, and comparability objectives.
Circular Dichroism (CD) Spectroscopy
We quantify backbone conformational content with high sensitivity and reproducibility using far-UV circular dichroism, the gold standard for rapid secondary structure assessment.
CD is particularly effective for dilute, clarified samples and provides rapid turnaround for comparability and stability assessments.
Fourier-Transform Infrared (FTIR) Spectroscopy
We analyze amide I vibrational modes to determine secondary structure composition, with particular strength for concentrated, turbid, or solid-state samples where CD may be limited.
FTIR serves as a critical orthogonal confirmation of CD results and excels in formulation development contexts.
Temperature-Dependent Structural Analysis
We monitor thermal unfolding of secondary structure elements to define stability boundaries, identify formulation liabilities, and support shelf-life projections.
These data guide formulation selection by identifying buffers and excipients that preserve native secondary structure across the intended storage and use conditions.
Comparative & Statistical Analysis
We rigorously compare secondary structure profiles across samples, batches, or stress conditions to detect subtle differences and support regulatory claims of equivalence or similarity.
Statistical frameworks ensure that observed differences are evaluated objectively against meaningful thresholds rather than visual impression alone.

Program Context:
A biosimilar developer required quantitative secondary structure evidence to demonstrate analytical similarity between their candidate monoclonal antibody and the reference product. Regulatory reviewers expected orthogonal CD and FTIR data with statistical evaluation of spectral equivalence to support the structural similarity claim.
Objective:
To generate a comprehensive secondary structure comparability package, including far-UV CD, FTIR amide I analysis, and temperature-dependent unfolding profiles, performed side-by-side under identical conditions with objective statistical comparison.
Approach:
Profacgen acquired far-UV CD spectra (190–260 nm) and FTIR amide I bands (1600–1700 cm⁻¹) for both the biosimilar and reference product. Spectra were deconvoluted by CDSSTR and second-derivative Gaussian fitting, respectively, to quantify α-helix, β-sheet, turn, and random coil content. Weighted spectral difference analysis and equivalence margin testing were applied to assess comparability.
Outcome:
Secondary structure content differed by less than 2% across all elements between the biosimilar and reference. CD and FTIR spectral overlays were statistically equivalent, and thermal unfolding profiles by temperature-dependent CD showed matching apparent Tm values. The data package satisfied regulatory expectations and supported progression to clinical comparability studies.
Program Context:
A pharmaceutical company observed unexpected viscosity increases and subvisible particle formation in a high-concentration antibody formulation candidate during accelerated stability studies. The team suspected formulation-induced perturbation of secondary structure but required biophysical evidence to identify the mechanism and guide reformulation.
Objective:
To identify the specific secondary structural alteration driving aggregation and to screen alternative formulations that maintain native backbone conformation under high-concentration conditions.
Approach:
We subjected the antibody to secondary structure profiling across four candidate formulations using far-UV CD for dilute samples and ATR-FTIR for high-concentration, viscosity-relevant conditions. Temperature-dependent CD and FTIR thermal ramps assessed stability boundaries, while intermolecular β-sheet band intensity at ~1625 cm⁻¹ was monitored as an aggregation indicator.
Outcome:
FTIR revealed a significant increase in intermolecular β-sheet content in the problematic formulation, indicative of aggregation-prone partial unfolding. CD confirmed a corresponding loss of native α-helix signature. A reformulated buffer identified through this screening restored native secondary structure profiles, eliminated intermolecular β-sheet signals, and reduced viscosity by 40% during accelerated stability testing.
Reference:
Fill out this form and one of our experts will respond to you within one business day.