We use cookies to understand how you use our site and to improve the overall user experience. This includes personalizing content and advertising. Read our
Privacy Policy
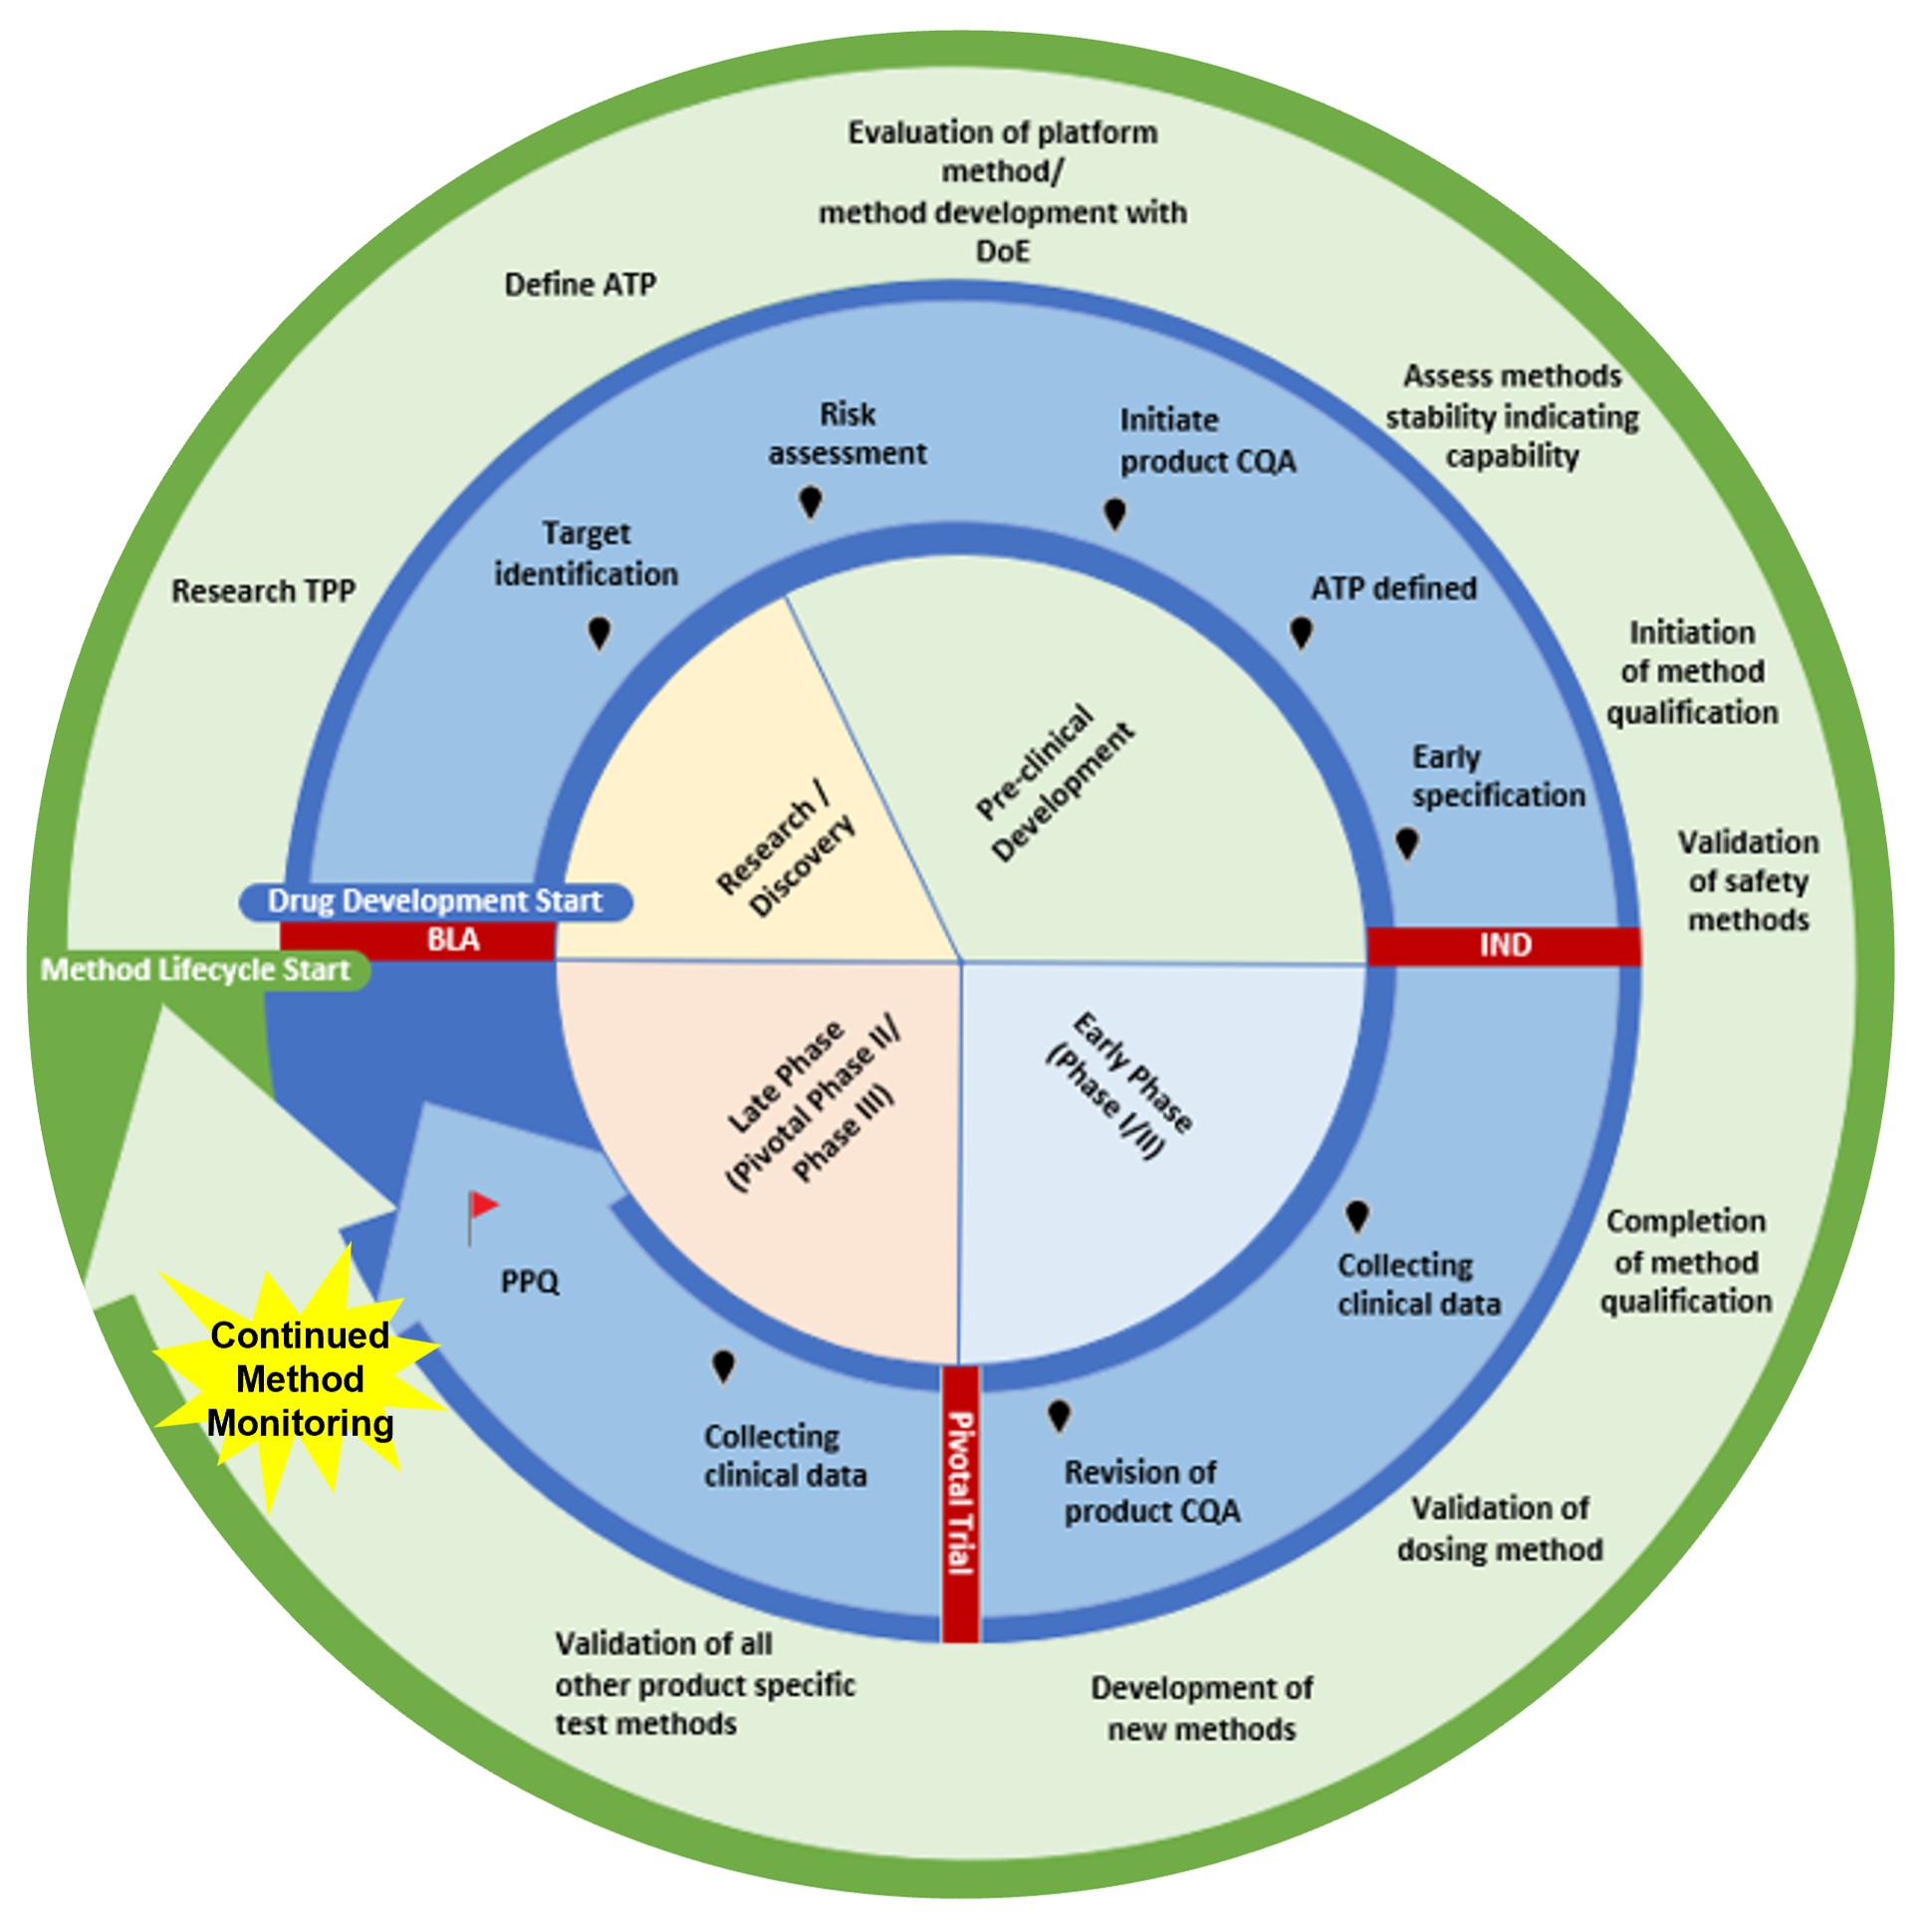
At Profacgen, our Continued Method Performance Monitoring service provides ongoing surveillance of analytical method performance throughout the product lifecycle, employing statistical process control and trend analysis to detect drift, identify emerging risks, and trigger proactive intervention before method-related quality events occur. Our monitoring programs transform method management from reactive troubleshooting into predictive quality assurance.
Analytical methods validated at a single point in time do not remain static in performance. Instrument components degrade, reagent lots vary, environmental conditions fluctuate, and analyst technique evolves subtly over time. These factors accumulate as method drift—a gradual degradation of precision, accuracy, or robustness that may not trigger immediate out-of-specification events but progressively erodes data reliability and regulatory confidence. Without systematic monitoring, this drift remains undetected until a critical failure occurs.
Why Continued Performance Monitoring Matters
Regulatory agencies increasingly expect analytical procedure lifecycle management to include continued performance verification. The revised ICH Q2(R2) and USP General Chapter <1220> emphasize that validation is not a one-time event but the beginning of an ongoing process of performance surveillance, knowledge accumulation, and evidence-based improvement. FDA inspection trends show rising scrutiny of method performance trending, with observations frequently citing inadequate monitoring of system suitability failures, reference standard degradation, and unexplained analytical variability.
The business case for performance monitoring extends beyond compliance. Unmonitored method drift leads to out-of-trend investigations, out-of-specification events, batch release delays, and costly remediation. Proactive monitoring detects emerging issues at the alert stage, enabling correction before action limits are breached and before batches are compromised. The return on investment for monitoring infrastructure is typically realized through prevention of a single major method-related quality event.
Key value drivers include:
Early detection of method drift through statistical control limits and trend analysis
Reduced incidence of OOS, OOT, and method-related deviation investigations
Data-driven justification for method enhancement, revalidation, or replacement
Regulatory inspection readiness with documented performance history and proactive management
Extended method lifespan through timely maintenance rather than premature replacement
These priorities ensure that analytical methods remain fit-for-purpose across years of routine use, manufacturing evolution, and regulatory scrutiny.
Core Capabilities of Performance Monitoring
Profacgen provides a structured, data-driven Continued Method Performance Monitoring service that aligns surveillance strategy with method criticality, regulatory requirements, and quality risk management principles.
Control Chart Implementation and Surveillance
Establishment of statistical process control charts for critical method performance indicators with defined alert and action limits. This includes:
Shewhart control charts for system suitability parameters (resolution, tailing factor, theoretical plates)
CUSUM (cumulative sum) charts for detecting small, sustained shifts in method performance
EWMA (exponentially weighted moving average) charts for smoothing random variation and highlighting trends
Individual and moving range charts for reference standard and control sample monitoring
Control limits are established from historical method capability data, with periodic re-evaluation as additional performance data accumulate.
Trend Analysis and Predictive Alerting
Statistical evaluation of method performance trends over time to identify gradual degradation and predict future performance. This includes:
Regression analysis of performance parameters against time, instrument usage, or reagent lot changes
Variance component analysis to identify sources of analytical variability (analyst, instrument, day, reagent)
Seasonal pattern detection for environmental or operational cyclical effects
Predictive modeling to forecast when performance parameters will approach acceptance criteria limits
Trend analysis transforms retrospective data review into forward-looking risk management, enabling scheduled maintenance rather than emergency response.
Annual Method Review and Performance Re-evaluation
Comprehensive annual assessment of method performance against predefined criteria, with documented conclusions and action plans. This includes:
Compilation and statistical summary of all method performance data from the review period
Comparison of current performance against validation baseline and historical trends
Evaluation of specification conformance rates, OOS/OOT frequency, and investigation outcomes
Assessment of method continued suitability and identification of enhancement opportunities
Annual reviews provide the structured, documented evidence of method stewardship that regulators expect for commercial products.
OOS/OOT Investigation and Root Cause Analysis
Structured investigation of out-of-specification and out-of-trend events with method performance contribution assessment. This includes:
Method performance review to determine whether analytical variability contributed to the event
Instrument and system suitability data evaluation at the time of the event
Reagent lot, reference standard, and environmental condition assessment
Analyst performance and training record review
Corrective and preventive action recommendations with method-focused remediation
Method-centric investigation distinguishes true product quality issues from analytical artifacts, preventing unnecessary batch rejection and supply disruption.
Monitoring Parameters and Metrics
Profacgen monitors diverse performance indicators tailored to method type and application:
Chromatographic methods: retention time precision, peak area reproducibility, resolution, tailing factor, theoretical plate count, signal-to-noise ratio, and baseline stability tracked per injection and aggregated across sequences
Electrophoretic methods: migration time consistency, peak integration reproducibility, gel image quality metrics, and capillary condition indicators monitored for degradation signatures
Mass spectrometry methods: mass accuracy drift, ionization efficiency trends, calibration stability, and sensitivity degradation tracked through standard compound monitoring
Biological assays: cell line passage effects, control sample trends, dose-response curve parameter stability (EC50, slope, top asymptote), and parallelism failure rates analyzed for assay system drift
Reference standards and controls: assay value trends, purity degradation, and storage stability monitored to detect standard deterioration before it compromises sample results
Predictive Quality Assurance: Statistical control charts and trend analysis detect performance degradation at the alert stage, enabling proactive correction before OOS events, batch delays, or regulatory observations occur.
Regulatory Lifecycle Compliance: Monitoring programs aligned with ICH Q2(R2), USP <1220>, and FDA expectations for continued method verification, providing documented evidence of method stewardship for inspections and submissions.
Root Cause Discrimination: Method-centric investigation capabilities distinguish true product quality issues from analytical variability, preventing unnecessary batch rejection and preserving supply continuity.
Data-Driven Enhancement Decisions: Accumulated performance data provide quantitative justification for method modification, revalidation, or replacement, replacing subjective judgment with evidence-based lifecycle management.
Extended Method Utility: Timely maintenance and minor optimization identified through monitoring extend method lifespan, deferring costly redevelopment and reducing total cost of analytical ownership.
Cross-Method Portfolio Visibility: Integrated monitoring across the analytical method portfolio identifies systemic issues—shared instruments, common reagents, environmental factors—affecting multiple methods, enabling efficient corrective action.
Representative Program Scenarios
Scenario 1: Control Chart Implementation for Commercial Release Methods
Program Context:
A commercially approved monoclonal antibody had experienced three unexplained potency assay failures over 12 months, each triggering lengthy OOS investigations and batch release delays. The quality team suspected method drift but lacked systematic data to identify the source or predict future failures.
Objective:
To implement a comprehensive performance monitoring program with control charts and trend analysis to detect method drift, identify root causes of variability, and prevent future OOS events.
Approach:
Profacgen established Shewhart control charts for critical potency assay parameters including EC50 precision, control sample assay values, and dose-response curve slope. Historical data from 24 months of routine testing were analyzed to establish control limits. CUSUM charts were implemented to detect small sustained shifts not visible on individual value plots. Within three months, the CUSUM chart identified a gradual upward drift in control sample values correlating with reference standard lot changes. Variance component analysis attributed 60% of recent variability to cell passage number effects. Alert limit triggers enabled scheduled reference standard replacement and cell line re-banking before action limits were breached.
Outcome:
OOS events were eliminated over the subsequent 18 months. Batch release delays due to potency investigations decreased by 85%. The monitoring program was cited positively during the next FDA inspection as an example of proactive analytical quality management.
A charge heterogeneity method for a commercial therapeutic protein had been in use for five years with acceptable but borderline performance. Specification conformance rates were declining, and analysts reported increasing difficulty meeting system suitability criteria. The program team needed data to justify method enhancement investment to management and regulators.
Objective:
To conduct comprehensive annual method review with statistical performance evaluation, identify degradation mechanisms, and provide quantitative justification for method enhancement.
Approach:
Profacgen compiled five years of method performance data including system suitability results, sample analysis outcomes, OOS/OOT investigations, and instrument maintenance records. Trend analysis revealed a statistically significant decline in resolution between acidic and main peak species, correlating with column lot variability and increased injection numbers. Variance component analysis showed that column-to-column differences now contributed 35% of total analytical variability, compared to 12% at validation. Predictive modeling indicated that resolution would fall below specification within 8–12 months at current degradation rates. The review documented method continued suitability with enhanced column qualification requirements and recommended column chemistry evaluation for long-term method robustness.
Outcome:
The quantitative review provided management with clear evidence supporting method enhancement investment. A column screening study identified an alternative chemistry with improved lot-to-lot consistency. The enhanced method was validated and implemented with maintained performance, and the monitoring program was expanded to include column performance trending as a leading indicator.
Q: What is the difference between method validation and continued performance monitoring?
A: Validation is a one-time formal demonstration that a method performs acceptably at a specific point in time. Continued performance monitoring is ongoing surveillance of method behavior during routine use to detect gradual drift, identify emerging risks, and ensure sustained fitness for purpose. Monitoring transforms method management from static compliance into dynamic quality assurance.
Q: How are control limits established for performance monitoring?
A: Control limits are typically established from historical method performance data collected during validation and routine use, using statistical methods such as mean plus/minus three standard deviations for Shewhart charts. Alert limits are set at mean plus/minus two standard deviations. Limits are periodically re-evaluated as additional data accumulate, with adjustments justified and documented when method improvements or changes affect baseline performance.
Q: What triggers method enhancement versus continued use?
A: Enhancement is triggered when monitoring data indicate that method performance is approaching or exceeding acceptance criteria, when trend analysis predicts future failure, or when regulatory requirements evolve beyond current method capability. Continued use is justified when performance remains stable within control limits, specification conformance is maintained, and no emerging risks are detected. Profacgen provides data-driven recommendations with quantitative risk assessment.
Q: How does performance monitoring support regulatory inspections?
A: Performance monitoring provides documented evidence of method stewardship, including control charts, trend analyses, annual reviews, and corrective action records. This documentation demonstrates proactive management of analytical quality, distinguishes method artifacts from product quality issues, and supports confident responses to reviewer questions about method reliability and continued suitability.
Q: Can monitoring programs be implemented for legacy methods without historical data?
A: Yes. For legacy methods without structured historical data, Profacgen conducts retrospective data mining from existing batch records, chromatograms, and test reports to establish baseline performance estimates. Control limits are initially set with wider margins based on available data and tightened as new data accumulate. The monitoring program is designed to mature over time as the performance database grows.
Q: What is the typical frequency of performance monitoring activities?
A: Real-time monitoring occurs with each analysis through system suitability evaluation and control sample inclusion. Control chart review is typically conducted monthly or quarterly depending on method usage frequency. Annual method reviews are conducted per regulatory expectation and quality system requirements. Alert limit triggers initiate immediate investigation regardless of scheduled review timing.
References:
ICH Q2(R2). Validation of Analytical Procedures. International Council for Harmonisation of Technical Requirements for Pharmaceuticals for Human Use; 2023.
United States Pharmacopeia. USP General Chapter <1220>: Analytical Procedure Lifecycle Management. United States Pharmacopeial Convention; current edition.
United States Pharmacopeia. USP General Chapter <1010>: Analytical Data—Interpretation and Treatment. United States Pharmacopeial Convention; current edition.
Online Inquiry
Fill out this form and one of our experts will respond to you within one business day.