We use cookies to understand how you use our site and to improve the overall user experience. This includes personalizing content and advertising. Read our
Privacy Policy
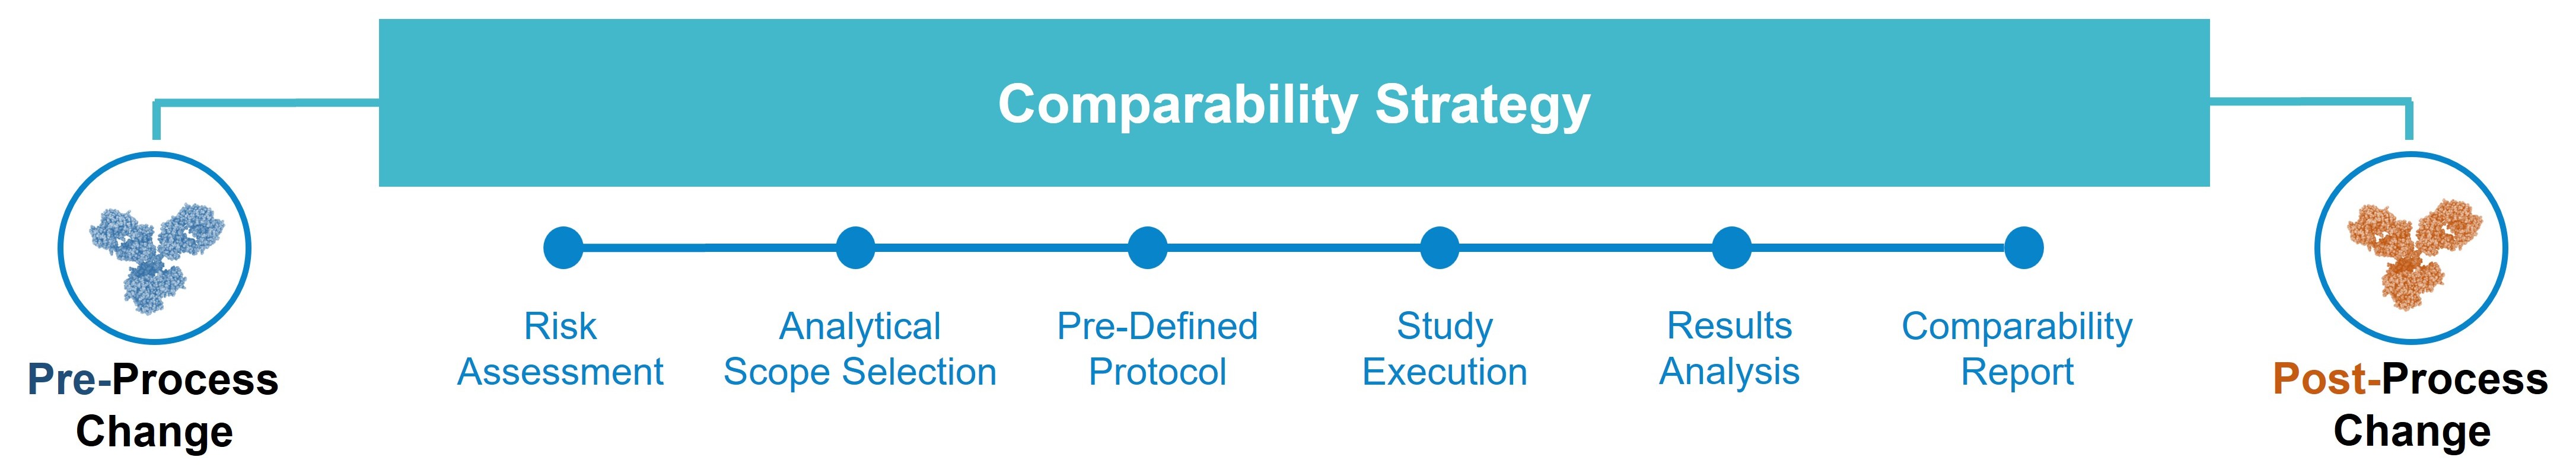
Profacgen offers Pre- and Post-Change Analytical Comparability service, providing structured, execution-focused analytical programs that directly compare product quality attributes before and after manufacturing changes. Our programs emphasize rigorous side-by-side testing, statistical evaluation, and objective data interpretation to generate defensible comparability conclusions with minimal residual uncertainty.
Analytical comparability is the operational core of every manufacturing change assessment. While regulatory strategy and process understanding provide the framework, the comparability conclusion ultimately rests on the quality of analytical data—how well pre-change and post-change products are characterized, how objectively differences are detected, and how rigorously statistical methods support the equivalence determination. Profacgen's execution-focused approach ensures that analytical programs generate data of sufficient quality, quantity, and statistical power to support confident regulatory decisions.
Pre-Change Baseline Characterization
Robust comparability assessment requires a well-characterized pre-change baseline that captures the natural batch-to-batch variability of the product under existing manufacturing conditions. Without adequate baseline data, apparent post-change differences cannot be distinguished from normal manufacturing variation, leading to false conclusions of non-comparability or missed detection of true change effects.
Historical data compilation: Aggregation of release testing, stability, and in-process data from representative pre-change lots to establish mean values, standard deviations, and distribution shapes
Retrospective variability assessment: Statistical evaluation of historical batch-to-batch variation to define normal operating ranges and alert limits for each critical quality attribute
Method performance baseline: Documentation of analytical method precision, system suitability trends, and control sample behavior during the pre-change period
Targeted baseline enhancement: Additional characterization of pre-change lots with enhanced analytical methods when historical data are insufficient for robust variability estimation
The baseline characterization directly informs acceptance criteria design: comparability margins are typically defined as multiples of pre-change standard deviation, ensuring that criteria reflect actual product variability rather than arbitrary thresholds.
Post-Change Testing Strategy
Post-change testing is designed to generate data of equivalent quality and quantity to pre-change baseline data, enabling valid statistical comparison:
Lot number determination: Power analysis to calculate the minimum number of post-change lots required to detect clinically meaningful differences with defined statistical confidence
Analytical panel alignment: Identical methods, instruments, and analysts for pre-change and post-change testing to minimize analytical variability confounding the comparison
Testing sequence control: Randomized or blocked testing designs preventing systematic bias from instrument drift, reagent lot changes, or analyst effects
Concurrent reference standard use: Identical reference materials for pre-change and post-change potency determinations ensuring calibration consistency
Side-by-Side Comparability Assessment
Direct analytical comparison of pre-change and post-change products using orthogonal methods executed under controlled conditions:
Assessment Domain
Execution Approach
Physicochemical Comparison
Intact mass and peptide mapping with LC-MS/MS executed on same instrument sequence
Chromatographic methods (SEC-HPLC, IEX, icIEF) with identical columns and mobile phases
Electrophoretic methods (CE-SDS, cIEF) with concurrent system suitability verification
Spectroscopic methods (CD, FTIR) with instrument calibration confirmation before each batch
Glycosylation Comparison
Released glycan analysis by HILIC-UPLC with identical column lots and gradient programs
Site-specific glycopeptide mapping with concurrent digestion and identical MS parameters
Sialic acid quantification with simultaneous calibration curve and control sample analysis
Purity and Impurity Comparison
Aggregate and fragment analysis by SEC-HPLC and CE-SDS with matched injection sequences
Charge variant profiling by icIEF with identical ampholyte lots and focusing conditions
Subvisible particle counting with instrument qualification verification and control sample inclusion
Host cell protein and DNA analysis with simultaneous assay execution and standard curve validation
Functional Comparison
Potency assays with pre-change and post-change samples on same assay plate or sequence
Binding assays (SPR, ELISA) with identical sensor chips, reagents, and calibration standards
Cell-based assays with concurrent cell passage, media lots, and incubation conditions
Effector function assays with matched effector cells and target cell preparations
Stability Comparison
Real-time stability samples stored in identical chambers with continuous monitoring
Accelerated stress studies with matched temperature, humidity, and pull point schedules
Forced degradation with identical stressor concentrations, durations, and neutralization procedures
Degradation product analysis with concurrent method execution and reference standard calibration
Trending & Statistical Analysis
Profacgen applies rigorous statistical methods to transform analytical data into objective comparability conclusions:
Descriptive statistics: mean, standard deviation, coefficient of variation, and distribution characterization for pre-change and post-change datasets
Equivalence testing (TOST): Two one-sided t-tests evaluating whether the mean difference falls within predefined comparability margins for critical quality attributes
Quality range analysis: Evaluation of whether post-change individual values and means fall within pre-change mean ± 3 standard deviations
Variance comparison: F-tests or Levene's tests assessing whether post-change variability exceeds pre-change variability, indicating process control degradation
Trend analysis: Evaluation of post-change data for temporal trends suggesting ongoing process drift rather than stable shift
Multivariate analysis: Principal component analysis (PCA) and orthogonal partial least squares (OPLS) for integrated evaluation of multiple correlated attributes
Similarity Acceptance Criteria
Acceptance criteria are predefined in the comparability protocol before testing begins, ensuring objective evaluation:
Tier 1 criteria (high-risk CQAs): Equivalence margins typically set at 1.5 × pre-change standard deviation, with 90% confidence interval evaluation by TOST
Tier 2 criteria (moderate-risk CQAs): Quality range acceptance with post-change mean and individual values within pre-change mean ± 3 SD
Tier 3 criteria (low-risk CQAs): Descriptive comparison with documented evaluation of observed differences and clinical relevance assessment
Variability criteria: Post-change coefficient of variation not exceeding 1.5 × pre-change CV for attributes with established precision requirements
Stability criteria: Post-change degradation rates within 20% of pre-change rates for shelf-life relevant attributes
Investigation of Observed Differences
When post-change data fall outside predefined acceptance criteria, Profacgen conducts structured investigation to determine significance and appropriate action:
Analytical artifact exclusion: Verification that the observed difference is product-related rather than method-related through re-testing, alternative methods, and system suitability review
Root cause analysis: Structured evaluation linking the observed difference to specific process parameters, raw materials, or equipment changes
Clinical relevance assessment: Evaluation of whether the magnitude and nature of the difference could affect safety or efficacy based on mechanism of action and prior knowledge
Retest and expanded testing: Additional lot testing, enhanced characterization, or orthogonal method confirmation to clarify ambiguous results
Regulatory strategy recommendation: Guidance on whether additional studies, process modification, or submission amendment is the most efficient resolution pathway
Execution Rigor: Side-by-side testing with identical methods, instruments, and reference standards minimizes analytical confounding, ensuring that detected differences reflect true product changes rather than method variability.
Statistical Power Optimization: Power analysis-driven lot number determination ensures sufficient sample size to detect clinically meaningful differences while avoiding excessive testing that consumes standard inventory and analytical resources.
Baseline Robustness: Comprehensive pre-change variability characterization establishes scientifically justified acceptance criteria based on actual manufacturing performance, not arbitrary thresholds.
Objective Difference Investigation: Structured protocols for analytical artifact exclusion, root cause analysis, and clinical relevance assessment prevent premature rejection of comparable products or acceptance of non-comparable materials.
Regulatory-Defensible Documentation: Predefined protocols with acceptance criteria, raw data packages, statistical analysis reports, and formal conclusions formatted for direct regulatory submission and inspection presentation.
Representative Case Studies
Case 1: Side-by-Side Potency Comparability for Cell Culture Change
Background:
A therapeutic protein manufacturer modified cell culture temperature profiles to improve yield. The change required potency comparability demonstration using a complex cell-based assay with historically high variability (RSD 12–15%), raising concerns about statistical power and false non-comparability conclusions.
Our Solution:
Profacgen executed a power analysis determining that 10 lots per condition provided 90% power to detect a 10% potency difference. Pre-change baseline data from 15 historical lots established mean and variability parameters. All 20 lots were tested on the same assay sequence with identical cell preparations, media lots, and reference standards. Testing order was randomized to eliminate sequence bias. TOST equivalence testing was applied with margins set at 1.5 × pre-change SD.
Final Results:
Post-change mean potency was 98.4% of pre-change with a 90% confidence interval of ±6.2%, well within equivalence margins of ±8.5%. Inter-assay variability was 11.2%, consistent with historical performance. The comparability conclusion was accepted by regulatory agencies without request for additional testing, supporting the cell culture change approval.
Case 2: Glycosylation Difference Investigation and Resolution
Background:
Post-change testing of a monoclonal antibody revealed a statistically significant increase in afucosylated glycans (18.2% vs. 14.5% pre-change mean), exceeding the predefined quality range. The difference triggered comparability failure and threatened to delay a critical manufacturing change implementation.
Our Solution:
Profacgen initiated structured difference investigation: (1) analytical artifact exclusion through re-testing with alternative glycan methods (MALDI-MS and CE-LIF) confirming the difference; (2) root cause analysis linking the increase to bioreactor pH shift during the change; (3) clinical relevance assessment demonstrating that afucosylation levels remained within reference product variability and literature ranges with no impact on ADCC activity; (4) expanded testing of 5 additional post-change lots showing consistent afucosylation with no temporal trend.
Final Results:
The investigation established that the difference was real but clinically irrelevant. ADCC activity remained equivalent, and pharmacokinetic modeling predicted no exposure impact. The comparability package included comprehensive justification for accepting the difference, supported by mechanism-of-action data and clinical relevance assessment. Regulatory agencies accepted the comparability conclusion with the glycan difference documented as not clinically meaningful.
Q: How many lots are required for robust pre-change baseline characterization?
A: A minimum of 8–15 pre-change lots is recommended to adequately estimate batch-to-batch variability and establish reliable standard deviation for acceptance criteria. More lots improve statistical confidence but may not be available from historical production. Profacgen evaluates baseline adequacy and recommends targeted pre-change characterization when historical data are insufficient.
Q: Why is side-by-side testing important for comparability?
A: Side-by-side testing with identical methods, instruments, reagents, and reference standards minimizes analytical variability that could confound the product comparison. Temporal separation between pre-change and post-change testing introduces method drift, reagent lot differences, and instrument calibration shifts that may be misinterpreted as product differences. Concurrent execution ensures valid statistical comparison.
Q: What statistical methods are most appropriate for analytical comparability?
A: Equivalence testing (TOST) is preferred for high-risk CQAs as it directly tests whether differences are within clinically meaningful margins. Quality range analysis (mean ± 3 SD) is suitable for moderate-risk attributes. Variance comparison (F-test) assesses process control stability. Multivariate analysis (PCA, OPLS) integrates multiple attributes for holistic evaluation. Method selection depends on attribute criticality, data distribution, and regulatory expectations.
Q: How are comparability acceptance criteria established?
A: Criteria are based on pre-change variability, analytical method precision, and clinical relevance. Equivalence margins are typically 1.5 × pre-change SD for Tier 1 CQAs. Quality ranges use pre-change mean ± 3 SD for Tier 2. Criteria are predefined in the protocol before testing to ensure objective evaluation and prevent post-hoc adjustment that would compromise statistical validity.
Q: What should be done when a post-change attribute exceeds acceptance criteria?
A: Exceedance triggers structured investigation: (1) verify the difference is product-related rather than analytical artifact; (2) identify root cause linking difference to specific process changes; (3) assess clinical relevance based on mechanism of action and prior knowledge; (4) determine whether expanded testing, process modification, or additional studies are required. Profacgen provides strategic guidance on the most efficient resolution pathway.
Q: Can historical pre-change data be used, or is new testing required?
A: Historical data can be used when generated with the same methods, under equivalent conditions, with documented quality. However, historical data may lack the analytical rigor of prospective studies. Profacgen evaluates historical data quality and recommends targeted pre-change testing when baseline data are insufficient for robust variability estimation or when methods have evolved since historical testing.
Q: What role does multivariate analysis play in comparability assessment?
A: Multivariate analysis integrates multiple correlated quality attributes into a holistic comparability evaluation, detecting patterns that individual univariate comparisons may miss. PCA and OPLS models can reveal whether post-change products fall within pre-change variability clouds, providing a more powerful overall comparability conclusion. Multivariate methods are particularly valuable for complex changes affecting multiple attributes simultaneously.
References:
ICH Q5E. Comparability of Biotechnological/Biological Products Subject to Changes in Their Manufacturing Process. International Council for Harmonisation of Technical Requirements for Pharmaceuticals for Human Use; 2004.
FDA Guidance for Industry. Statistical Approaches to Establishing Bioequivalence. U.S. Food and Drug Administration; 2001.
EMA. Guideline on the Investigation of Bioequivalence. European Medicines Agency; 2010.
Yu W, Ramprasad MP, Pal M, et al. Analytical comparability to evaluate impact of manufacturing changes of ARX788, an Anti-HER2 ADC in late-stage clinical development. Lockridge O, ed. PLoS ONE. 2023;18(7):e0284198. doi:10.1371/journal.pone.0284198
Online Inquiry
Fill out this form and one of our experts will respond to you within one business day.