We use cookies to understand how you use our site and to improve the overall user experience. This includes personalizing content and advertising. Read our
Privacy Policy
Cell signaling assays provide direct functional readouts of intracellular communication pathways, capturing the dynamic molecular events that translate extracellular stimuli into cellular responses. These assays measure post-translational modifications, second messenger generation, ion fluxes, and transcriptional activation to reveal how receptors, kinases, phosphatases, and adapter proteins orchestrate physiological and pathological processes. Unlike static binding measurements, cell signaling assays report on pathway integrity, signal amplification, feedback regulation, and crosstalk in native cellular contexts—information essential for validating drug targets, characterizing therapeutic mechanisms, and predicting clinical efficacy. Profacgen offers comprehensive Cell Signaling Assay services encompassing phosphoprotein analysis, second messenger quantification, calcium imaging, and pathway-specific reporter systems to support drug discovery, biosimilar potency testing, and mechanistic investigation across oncology, immunology, neuroscience, and metabolic disease.
Introduction: Assay Principle, Workflow, and Biological Meaning
Assay Principle
Figure 1. Cell signaling cascade overview. Extracellular ligand binding activates membrane receptors, triggering phosphorylation cascades, second messenger generation, and calcium flux that converge on transcriptional and functional cellular responses. (Norris and Carr, 2021)
Cell signaling assays detect the biochemical intermediates and molecular outputs of signal transduction cascades. The three primary measurement classes—phosphorylation, second messenger generation, and calcium flux—capture distinct temporal and mechanistic dimensions of cellular communication:
Phosphorylation: Reversible addition of phosphate groups to serine, threonine, or tyrosine residues by kinases, and their removal by phosphatases, serves as the dominant regulatory switch in signal transduction. Phosphoprotein assays using phospho-specific antibodies enable site-resolved quantification of kinase activation state, substrate engagement, and pathway node activity
Second Messengers: Small diffusible molecules—including cyclic AMP (cAMP), cyclic GMP (cGMP), inositol 1,4,5-trisphosphate (IP3), diacylglycerol (DAG), and phosphatidylinositol 3,4,5-trisphosphate (PIP3)—amplify and propagate signals from membrane receptors to intracellular effectors. Their concentration changes reflect G protein-coupled receptor (GPCR), receptor tyrosine kinase (RTK), and ion channel activity with high temporal fidelity
Calcium Flux: Cytosolic calcium concentration ([Ca2+]i) serves as a ubiquitous second messenger regulating exocytosis, muscle contraction, gene transcription, and apoptosis. Ligand-gated and voltage-gated calcium channels, together with IP3-mediated endoplasmic reticulum release, generate spatially and temporally complex calcium signals decoded by calmodulin and calcium-dependent kinases
Workflow
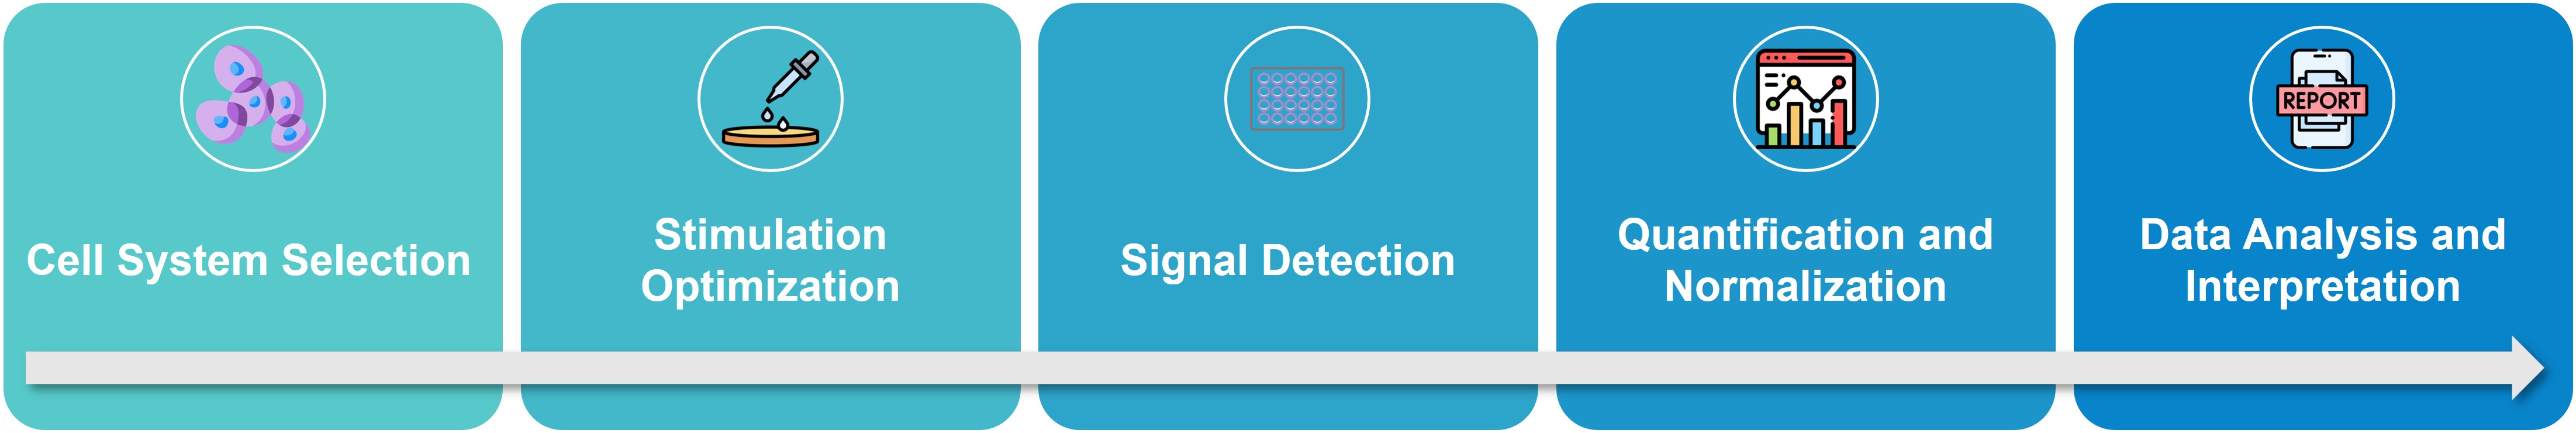
Profacgen executes cell signaling assays through a rigorous, physiologically informed workflow:
Cell System Selection: Selection of endogenous or recombinant cell lines expressing the target receptor and intact downstream signaling machinery; primary cell validation for translational relevance; genome-edited knockout or knock-in lines for pathway component validation
Stimulation Optimization: Ligand concentration and exposure time titration to achieve maximal pathway activation without receptor desensitization; serum starvation protocols to reduce basal signaling noise; co-stimulation with pathway-specific activators and orthogonal inhibitors to confirm mechanism specificity
Signal Detection: Cell lysis under conditions preserving phosphoprotein integrity (phosphatase inhibitors, rapid cooling); homogeneous or heterogeneous assay formats (TR-FRET, AlphaLISA, Western blot, flow cytometry) matched to throughput and resolution requirements; live-cell imaging for kinetic calcium and second messenger dynamics
Quantification and Normalization: Total protein normalization for phosphoprotein assays; internal standard calibration for second messenger quantification; ratiometric FRET or BRET correction for live-cell biosensors; background subtraction and vehicle control normalization
Data Analysis and Interpretation: Dose-response curve fitting for EC50/IC50 determination; time-course kinetic analysis for activation and desensitization rates; pathway node mapping through multi-parameter phosphoprotein profiling; correlation with functional outcomes (proliferation, apoptosis, cytokine secretion)
Biological Meaning
Cell signaling assays provide functional insights unavailable from binding or gene expression measurements alone:
Pathway Integrity: Confirmation that the complete signaling cascade—from receptor through intermediate kinases to terminal effectors—is intact and responsive in the cellular context of interest
Signal Amplification and Dynamics: Quantification of fold-induction, signal duration, and oscillation frequency that determine biological outcome; weak binding agonists may generate robust signals through amplification, while high-affinity antagonists may fail to block signaling if they act as inverse agonists
Biased Signaling: Detection of ligand-selective pathway activation (e.g., GPCR β-arrestin bias versus G protein bias) that predicts distinct therapeutic efficacy and side effect profiles from identical receptor occupancy
Feedback and Adaptation: Identification of receptor desensitization, pathway negative feedback, and crosstalk that modulate drug response over time and explain tachyphylaxis or paradoxical activation
Applications
Cell signaling assays serve critical roles across therapeutic discovery and development:
Kinase Inhibitor Development: Selectivity profiling against multiple kinase substrates and downstream pathway nodes; confirmation of on-target pathway suppression and detection of compensatory bypass activation
GPCR Pharmacology: Pathway-biased ligand characterization through cAMP, IP1, calcium, and β-arrestin recruitment multiplexing; allosteric modulator mechanism deconvolution
Immunomodulatory Drug Assessment: JAK-STAT, NF-κB, and MAPK pathway profiling for cytokine receptor modulators; T cell receptor and B cell receptor signaling analysis for immune checkpoint and CAR-T programs
Oncology Target Validation: Oncogene addiction confirmation through pathway suppression sensitivity; resistance mechanism identification via bypass pathway activation (PI3K/AKT feedback upon MEK inhibition)
Biosimilar and Therapeutic Potency: Quantitative comparison of pathway activation or inhibition between innovator and biosimilar; batch release testing with reference standard calibration
Neuroscience Drug Discovery: Calcium imaging for ion channel modulators; cAMP dynamics for GPCR neurotransmitter receptors; CREB phosphorylation for memory-enhancing compound screening
Service Capabilities
Profacgen provides a comprehensive suite of cell signaling assay services with validated protocols, optimized detection platforms, and flexible formatting.
Phosphoprotein Analysis
Assay Format
Detection Method
Throughput
Key Applications
Western Blot
Chemiluminescent or fluorescent secondary antibodies; phospho-site-specific primary antibodies
Gs- and Gi-coupled GPCR activity measured by competitive immunoassays (TR-FRET, AlphaLISA, HTRF) or live-cell biosensors (Epac-based FRET, luciferase-based cAMP biosensors); forskolin-stimulated adenylyl cyclase as a positive control; PDE inhibitors for signal potentiation
IP1 Accumulation
Gq-coupled GPCR activation quantified by inositol phosphate accumulation using homogeneous IP-One HTRF or AlphaLISA formats; LiCl inclusion to block IPPase and amplify signal; orthogonal calcium flux confirmation
cGMP Detection
Nitric oxide and natriuretic peptide receptor signaling measured by competitive immunoassay; sildenafil-sensitive PDE5 modulation; PKG activation downstream validation
PIP3 Detection
PI3K/AKT pathway activation quantified by ELISA or TR-FRET using PIP3-specific binding domains (GRP1-PH); correlation with AKT phosphorylation and mTOR activity
Calcium Flux Assays
Fluorescent Dye-Based Calcium Imaging
Fura-2, Fluo-4, and Cal-520 loaded cells imaged by plate-based fluorescence readers or high-content microscopes; kinetic acquisition at 1–10 Hz for rapid transient detection; ionomycin and thapsigargin as positive controls
Aequorin Bioluminescence
Mitochondrial aequorin-expressing cell lines for GPCR and ion channel calcium coupling; high signal-to-noise, no excitation phototoxicity, compatible with 384-well screening
Genetically Encoded Calcium Indicators (GECIs)
GCaMP6/7 and jRCaMP1 sensors for long-term, repeated calcium measurements in stable cell lines or primary neurons; two-photon compatible for tissue slice applications
Simultaneous Voltage and Calcium Recording
Voltage-sensitive dyes or genetically encoded voltage indicators (GEVIs) combined with calcium reporters for coupled excitability analysis in cardiomyocytes and neurons
Deliverables
Each cell signaling assay project includes comprehensive analytical documentation and expert mechanistic interpretation:
Normalized signal intensity with fold-induction or percent inhibition relative to vehicle and positive controls
Dose-response parameters: EC50, IC50, Emax, Hill slope with 95% confidence intervals
Multi-Parameter Pathway Profiling: Simultaneous quantification of phosphorylation, second messengers, and calcium flux across multiple pathway nodes to generate comprehensive signaling fingerprints rather than isolated snapshots
High-Throughput Screening Formats: 384- and 1536-well homogeneous assays (AlphaLISA, TR-FRET) enabling 10,000+ compound weekly throughput with robust Z'-factor performance
Single-Cell Resolution: Flow cytometry phospho-flow and live-cell imaging capturing population heterogeneity, rare cell responses, and cell cycle-dependent signaling variations invisible to bulk assays
Kinetic and Temporal Analysis: Rapid acquisition systems (1–100 Hz) resolving calcium transients, second messenger oscillations, and phosphorylation cascades with sub-second precision
Integrated Mechanistic Interpretation: Expert correlation of signaling data with binding kinetics, gene expression, and functional outcomes to generate predictive pharmacological hypotheses
Representative Case Studies
Case 1: Multi-Node Phosphoprotein Profiling Reveals MEK Inhibitor Resistance Mechanism in BRAF-Mutant Melanoma
Background:
A clinical-stage MEK inhibitor (trametinib analog) showed promising efficacy in BRAFV600E melanoma cell lines but rapid emergence of resistance in long-term cultures. Standard proliferation assays indicated resistance but could not distinguish between target mutation, pathway bypass, or histological transdifferentiation mechanisms—information critical for combination therapy design.
Our Solution:
Profacgen implemented a multi-timepoint phosphoprotein profiling panel using AlphaLISA SureFire assays across 12 pathway nodes: pERK1/2 (T202/Y204), pMEK1/2 (S217/S221), pRSK (S380), pAKT (S473), pS6 (S235/236), p4E-BP1 (T37/46), pGSK3β (S9), pSTAT3 (Y705), pJNK (T183/Y185), pp38 (T180/Y182), pCREB (S133), and pH2AX (S139). Parental and resistant cell lines were profiled at 0, 1, 4, 8, and 24 hours post-MEK inhibitor treatment (10 nM), with parallel RNA-seq for transcriptional feedback analysis.
Final Results:
Phosphoprotein profiling revealed that resistant cells maintained MEK-ERK pathway suppression (pERK reduced >90%) but showed paradoxical PI3K-AKT activation (pAKT increased 8-fold at 4 hours) and mTORC1 hyperactivation (pS6 increased 12-fold). RNA-seq identified MET receptor upregulation as the bypass driver. The combination of MEK inhibitor with crizotinib (MET inhibitor) restored pAKT and pS6 suppression and resensitized resistant cells to proliferation inhibition. This phosphoprotein-guided combination strategy entered a Phase Ib clinical trial with biomarker-selected patient enrollment.
Case 2: Calcium Oscillation Fingerprinting for GPCR Allosteric Modulator Classification
Background:
A medicinal chemistry program targeting the M1 muscarinic acetylcholine receptor (M1 mAChR) for Alzheimer's disease cognitive enhancement identified multiple positive allosteric modulators (PAMs) with similar binding affinity but divergent efficacy in behavioral models. Standard cAMP and IP1 assays showed comparable pathway activation, failing to explain the in vivo discrepancy.
Our Solution:
Profacgen established a live-cell calcium imaging platform using Fluo-4-loaded CHO-M1 cells with high-speed confocal acquisition (10 Hz). The hypothesis that distinct PAMs generate different calcium oscillation patterns—decoded by downstream calcium-dependent kinases into differential gene expression—was tested by profiling six PAM chemotypes across concentration-response and time-course matrices. Oscillation parameters (peak frequency, amplitude, regularity index, and spatial propagation) were extracted by automated image analysis and correlated with CREB-driven luciferase reporter activity.
Final Results:
Calcium fingerprinting revealed three distinct oscillation phenotypes: PAMs A and B generated high-frequency, regular oscillations (2–3 Hz) with rapid nuclear translocation of NFAT and robust CREB activation; PAMs C and D produced low-frequency, irregular spikes with minimal CREB response despite equivalent peak [Ca2+]i; and PAMs E and F showed sustained, non-oscillatory elevation with intermediate CREB activation. Only the high-frequency oscillation phenotype correlated with cognitive enhancement in mouse novel object recognition. The calcium oscillation signature was incorporated as a secondary pharmacodynamic endpoint in the lead PAM's clinical development program, providing a translatable biomarker between preclinical models and human PET imaging.
Q: How do cell signaling assays differ from reporter gene assays for pathway analysis?
A: Cell signaling assays measure the direct biochemical intermediates of signal transduction—phosphorylation events, second messenger concentrations, and ion fluxes—providing proximal, rapid readouts with high temporal resolution (seconds to minutes). Reporter gene assays measure transcriptional outputs downstream of signaling, integrating pathway activity over hours and capturing nuclear events but with slower kinetics and greater regulatory complexity. Cell signaling assays are preferred for: (1) kinetic analysis of rapid pathway activation and desensitization; (2) discrimination of signaling biases at the receptor-proximal level; (3) kinase inhibitor mechanism validation; and (4) correlation with direct biochemical targets. Reporter gene assays are preferred for: (1) high-throughput screening where signal amplification improves sensitivity; (2) transcription factor-specific pathway isolation; and (3) biosimilar potency testing where integrated cellular response is the regulatory endpoint. Profacgen often employs both in combination, using signaling assays for mechanistic deconvolution and reporter assays for screening and potency confirmation.
Q: What controls are essential to confirm specificity in phosphoprotein assays?
A: Phosphoprotein assay specificity requires multiple validation layers: (1) phosphatase treatment (λ-phosphatase) to confirm signal dependence on phosphate groups; (2) competition with phospho-peptide antigen during antibody generation or assay execution; (3) total protein normalization using pan-specific antibodies to control for expression level variation; (4) orthogonal kinase inhibitors to confirm pathway dependence (e.g., U0126 for MEK-ERK, LY294002 for PI3K-AKT); (5) siRNA or gene knockout of the target kinase to eliminate antibody cross-reactivity with off-target phosphoproteins; (6) phospho-site mutants (serine/threonine/tyrosine to alanine) to validate residue specificity; and (7) correlation with mass spectrometry phosphoproteomics for novel or poorly characterized sites. Profacgen implements standard controls for all validated assays and develops custom validation packages for novel phospho-targets.
Q: Can calcium flux assays distinguish between different receptor mechanisms?
A: Yes, calcium signals exhibit distinct spatiotemporal signatures that encode receptor identity and mechanism. Gq-coupled GPCRs typically generate rapid, transient calcium spikes (peak within 5–10 seconds, decay within 30–60 seconds) through IP3-mediated ER release. Ion channel activation produces sustained calcium elevation or oscillatory patterns depending on channel kinetics. Store-operated calcium entry (SOCE) through Orai channels generates slower, sustained rises following ER depletion. Profacgen discriminates these mechanisms through: (1) pharmacological tool compounds (thapsigargin for SOCE, 2-APB for TRP channels, nifedipine for L-type calcium channels); (2) chelation strategies (EGTA for extracellular calcium dependence, BAPTA-AM for intracellular buffering); (3) kinetic parameter extraction (rise time, decay rate, oscillation frequency); and (4) simultaneous IP3 or cAMP measurement for pathway decomposition. These analyses enable mechanism-based drug classification beyond simple agonism/antagonism.
Q: How do you handle cell line variability and passage-dependent signaling drift?
A: Cell signaling is exquisitely sensitive to culture conditions, passage number, confluence, and serum batch. Profacgen implements rigorous standardization: (1) low-passage working stocks (passage < 15) with regular authentication by STR profiling; (2) defined serum lots qualified for signaling consistency and reserved for project duration; (3) confluence standardization (typically 70–80% at assay execution) to avoid contact inhibition artifacts; (4) serum starvation protocols (0.1–1% FBS, 4–24 hours) to reduce basal pathway noise without inducing stress responses; (5) positive and negative control inclusion in every plate for Z'-factor monitoring; (6) reference compound tracking across experiments to detect assay drift; and (7) cryopreserved assay-ready cells for longitudinal studies to eliminate passage accumulation effects. For primary cells, we establish donor-specific signaling baselines and normalize test compound effects to donor-matched vehicle controls.
Q: What is the relationship between cell signaling assay results and in vivo pharmacology?
A: Cell signaling assays provide mechanistic insights that correlate with but do not guarantee in vivo efficacy. The translation depends on: (1) target expression level and isoform distribution in vivo versus in vitro; (2) tissue-specific pathway wiring and feedback architecture; (3) pharmacokinetic exposure achieving concentrations required for signaling modulation; (4) compensatory pathway activation or resistance mechanisms emerging in complex tissue environments; and (5) off-target effects not captured by the specific signaling node under study. Profacgen enhances translational predictability through: (1) primary cell and patient-derived model validation; (2) multi-node pathway profiling to identify bypass vulnerabilities; (3) correlation with ex vivo tissue signaling from preclinical species; (4) biomarker-guided dose selection linking cellular IC50 to plasma exposure; and (5) integration with pharmacokinetic/pharmacodynamic modeling to project in vivo target engagement from cellular potency data.
Q: What is the typical project timeline for cell signaling assay development?
A: Standard timelines are: (1) 3–4 weeks for assay execution using validated phospho-specific antibodies and established cell lines; (2) 4–6 weeks for cell line selection and stimulation optimization including ligand titration, time-course determination, and serum condition evaluation; (3) 6–8 weeks for phospho-antibody validation including phosphatase sensitivity, siRNA knockdown confirmation, and mass spectrometry correlation for novel sites; (4) 8–10 weeks for live-cell calcium or second messenger biosensor development including dye loading optimization, kinetic acquisition protocol establishment, and automated analysis pipeline construction; (5) 10–12 weeks for full GLP-compliant assay validation with documented precision, accuracy, specificity, and stability testing. High-throughput screening campaigns on validated assays require 2–3 weeks for single-concentration primary screens and 4–6 weeks for multi-point dose-response confirmation. Custom pathway panel development with 6–12 phospho-nodes typically requires 8–12 weeks for antibody selection, cross-reactivity testing, and multiplex optimization.
References:
Norris DO, Carr JA. Synthesis, metabolism, and actions of bioregulators. In: Vertebrate Endocrinology. Elsevier; 2021:43-90. doi:10.1016/B978-0-12-820093-3.00003-4
Online Inquiry
Fill out this form and one of our experts will respond to you within one business day.
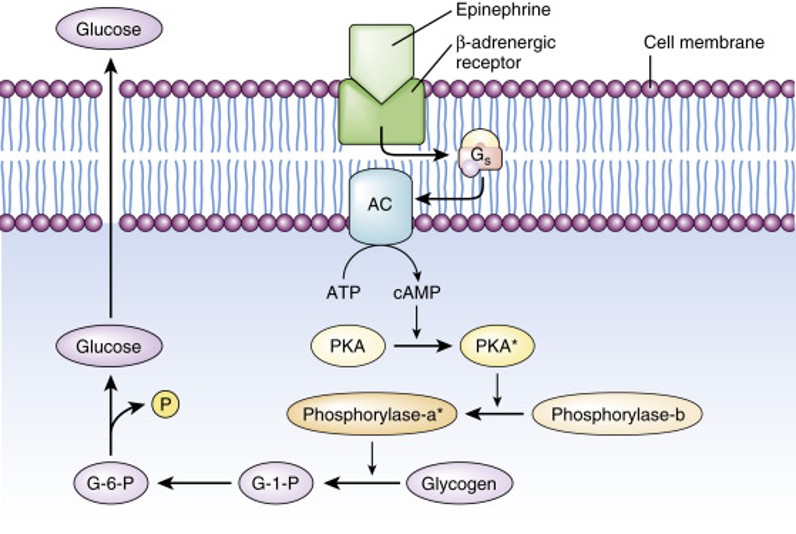 Figure 1. Cell signaling cascade overview. Extracellular ligand binding activates membrane receptors, triggering phosphorylation cascades, second messenger generation, and calcium flux that converge on transcriptional and functional cellular responses. (Norris and Carr, 2021)